

Question: Using figure 1, estimate the CO2 concentration in 1969. Estimate the CO2 concentration in 2015. Carbon Dioxide Levels Over Time Scientists are concerned about global
Using figure 1, estimate the CO2 concentration in 1969. Estimate the CO2 concentration in 2015.
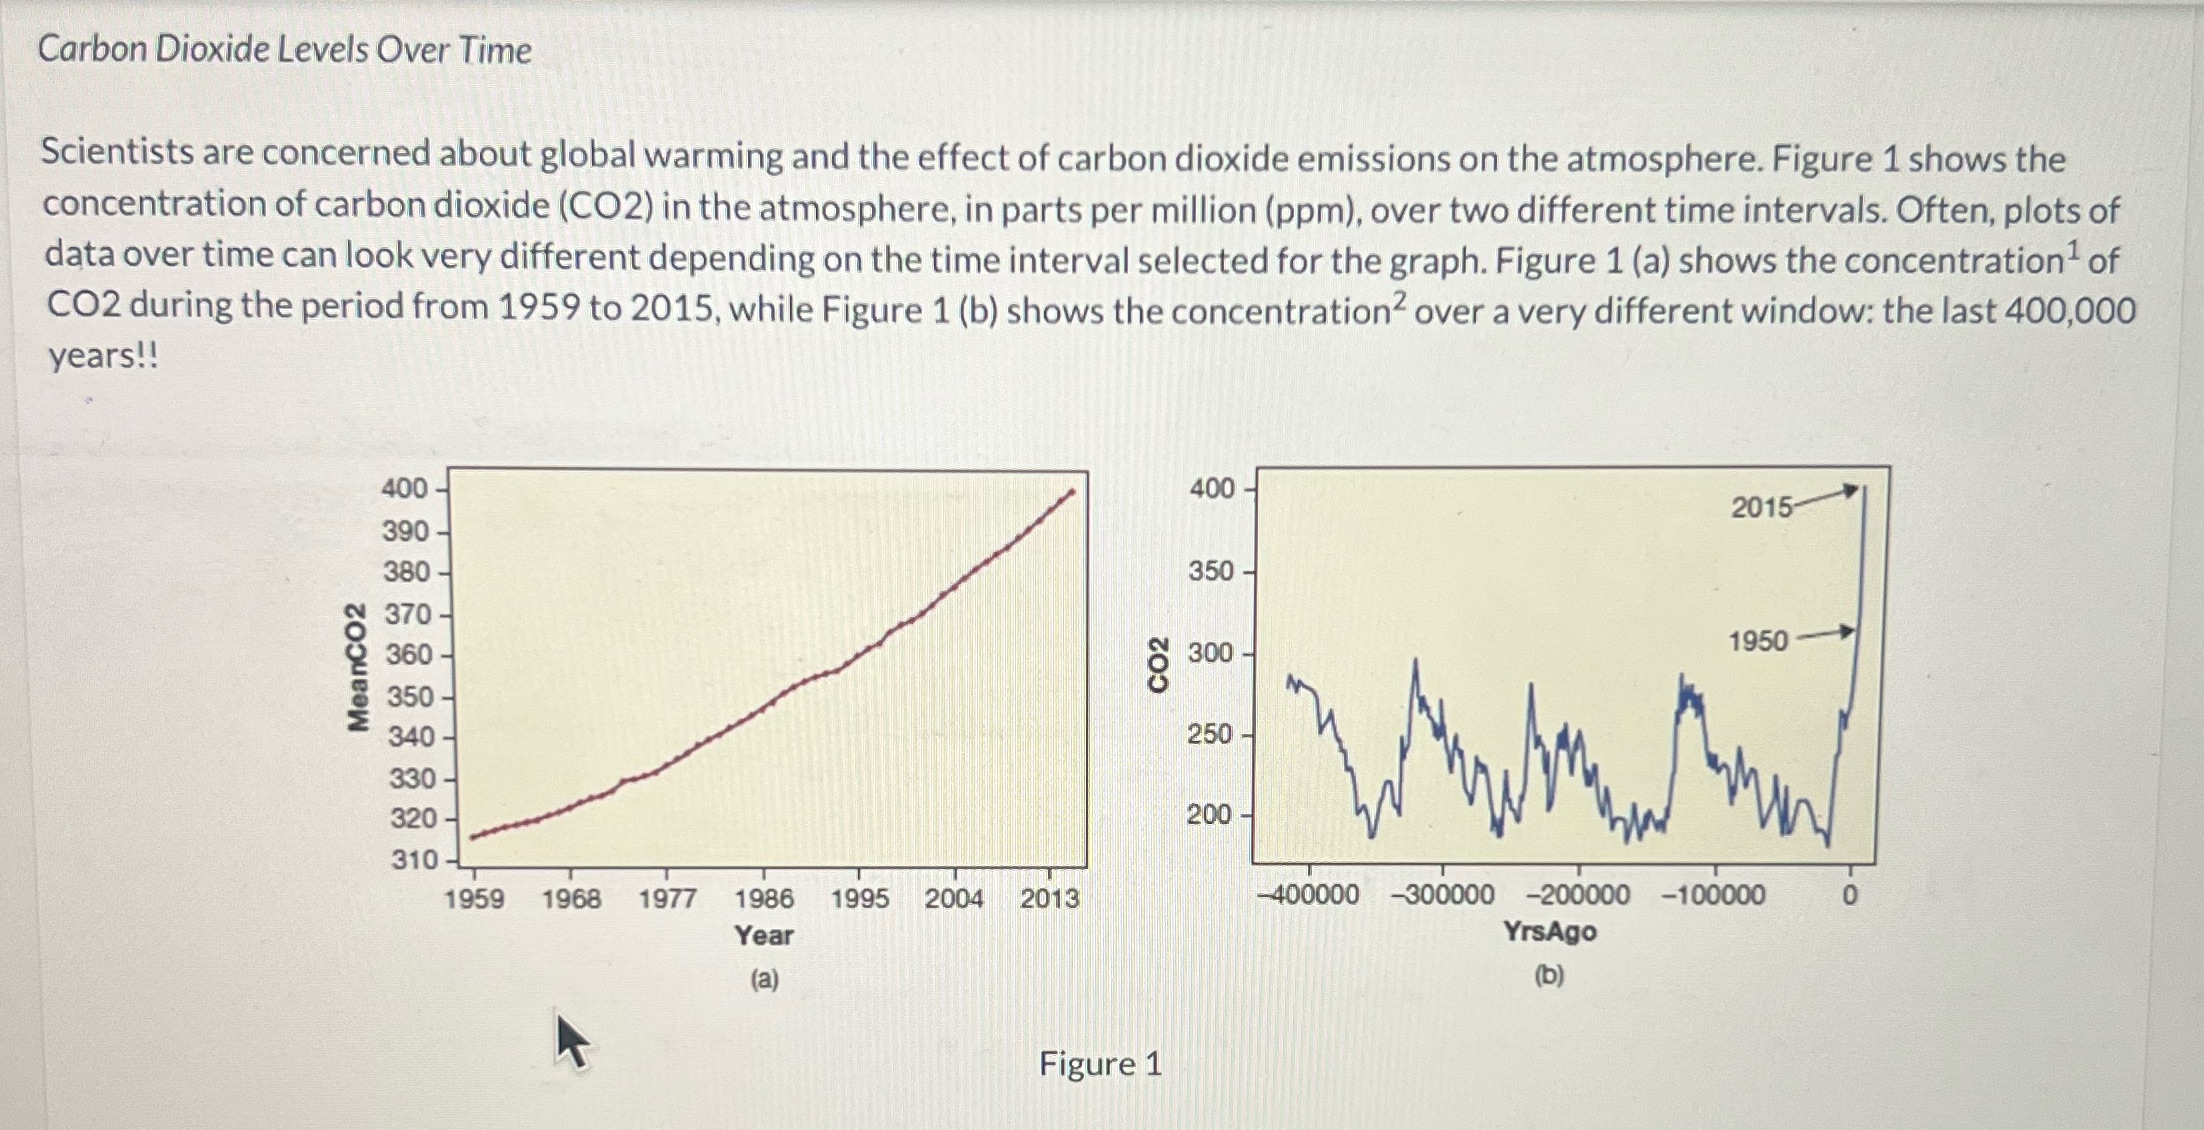
Carbon Dioxide Levels Over Time Scientists are concerned about global warming and the effect of carbon dioxide emissions on the atmosphere. Figure 1 shows the concentration of carbon dioxide (CO2) in the atmosphere, in parts per million (ppm), over two different time intervals. Often, plots of data over time can look very different depending on the time interval selected for the graph. Figure 1 (a) shows the concentration of CO2 during the period from 1959 to 2015, while Figure 1 (b) shows the concentration over a very different window: the last 400,000 years! 400 - 400 2015 390 - 380 - 350 370 - 360 - 300 - 1950 CO2 MeanCO2 350 - 340 - 250 330 - 320 - 200 310 - 1959 1968 1977 1986 1995 2004 2013 -400000 -300000 -200000 -100000 0 Year YrsAgo (a) (b) Figure 1
Step by Step Solution
There are 3 Steps involved in it

Get step-by-step solutions from verified subject matter experts