

Question: Using Figure 14.1 answer the following questions a. What was the settle price for August 2019 cattle feeder futures on this date? What is the
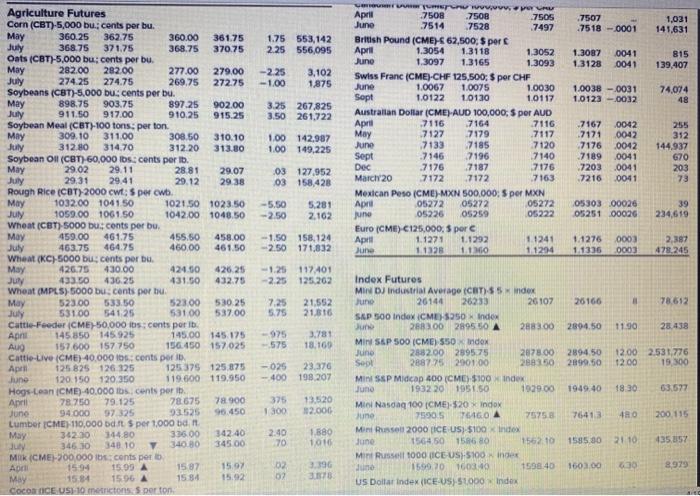
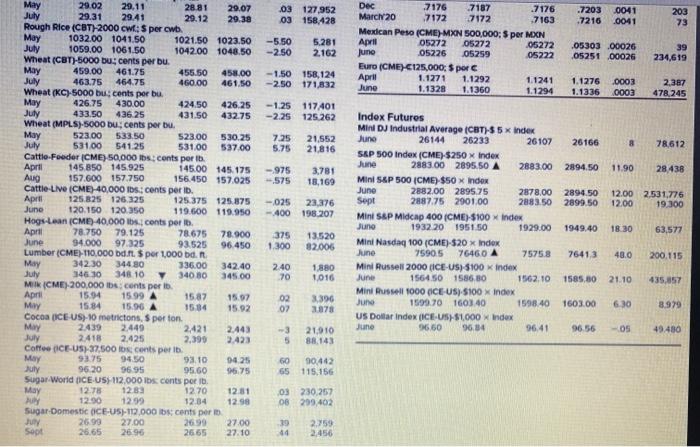
Using Figure 14.1 answer the following questions a. What was the settle price for August 2019 cattle feeder futures on this date? What is the total dollar value of this contract at the close of trading for the day? (Input all amounts as positive values. Enter the settle price in dollars rounded to 4 decimal places and round the dollar value to 2 decimal places.) Settle price Dollar value b. What was the settle price for April 2019 silver futures on this date? If you held 25 contracts, what is the total dollar value of your futures position? (Input all amounts as positive values. Enter the settle price in dollars rounded to 4 decimal places and round the dollar value to the nearest whole number.) Settle price Dollar value 1. Suppose you held an open position of 70 September 2019 mini S&P 500 futures on this day. What is the change in the total collar c-1. Suppose you held an open position of 70 September 2019 mini S&P 500 futures on this day. What is the change in the total dollar value of your position for this day's trading? (A negative value should be indicated by a minus sign.) Dollar value -2. If you held a long position, would this represent a profit or a loss to you? O Profit Loss d. Suppose you are short 200. January 2019 soybean oil futures contracts. Would you have made a profit or a loss on this day? Profit Loss Open Interest Settle Chg Contract Open High hilo Low Cotton (ICE-US)-50,000 lbs. cents per ib. May 78.18 78.35 77.32 July 78.84 78.09 Orange Juice (ICE-US) 15,000 lbs, cents per ib. May 108.90 109.80 108.20 July 113.70 114.35 111.85 78.73 77.62 78.46 - 47 -01 51.151 81,051 103.60 112.20 -80 -1.95 10.496 7,078 Futures Contracts WSJ.com/commodities Metal & Petroleum Futures Contract Open Open High hilo Low Settle Chg interest Copper-High (CMX) 25,000 lbs.: $ perib, April 2.9225 -0.0090 1,264 May 2.9325 29425 2.9110 2.9255 -0.008s 92,345 Gold (CMX-100 troy oz: $ per troy oz. April 1304.00 1304.00 1301.501309.10 5.60 325 Juno 1308.201314.70 1304.70 1313.90 5.60 331,311 Aug 1314.50 1320.70 1311.00 1319.90 5,60 50,769 Doc 1326.50 1332 20 1322 80 1331.90 5.60 36,080 Fob 20 1329.90 1337.90 1329.90 1337.90 5.50 11,597 April 1337.30 1343.10 1334,80 1343.60 5.50 6,985 Palladium (NYM)-50 troy 02: Sper troy oz. April 1366.40 0.60 1 June 1362.60 1371.50 1355.00 1363 20 0.60 19,677 Sept 1356 40 1361.70 1349 20 1356.80 140 2.205 Platinum YMI troy oz: $ per troy oz. April 900.00 900.00 900.00 903.20 9.30 67 July 896.10 912.80 890,50 908.90 9.60 69.489 Silver (CMX)-5.000 troy oz. $ per troy oz. April 15.170 15.205 15.095 15.201 0.033 16 May 15.185 15.265 15.115 15.244 0,033 117,796 Crude Oil, Light Sweet (NYM) 1000 bols: $ por bol. May 64.22 64.70 64.05 64.61 0.63 280,173 June 6420 6471 A 6401 64.65 0.69 321,402 July 64.12 64.69 6393 64.67 0.76 189.217 sept 63.72 64.40 A 63.55 64.38 0.82 154,891 Dec 62.73 63.47 A 6257 63.46 084 199.537 Doc 20 58.73 59.29 A 58.68 59.28 0.56 118,733 NY Harbor ULSD (NYM) 42.000 gal pergal 2.0510 2 0897 20488 2.0876 0427 50.825 June 20575 20910 A 2.0520 2.0892 0412 79,735 Gasoline NY RBOB (NYM)-42.000 g:s pergal May 20105 2.0702 A 20105 2.0692 0702 108.354 June 1.9850 20307 A 1.9800 2.0297 0598 101.754 Natural Gas (NYM) 10,000 MMB; per MMOTU May 2.705 2729 2.686 2.700 001 187,831 June 2.749 2.768 2726 003 167.620 2 305 2824 July 2786 2.801 003 125.844 Aug 2032 2.319 2013 2827 003 71405 Sept 2827 2 non 2821 144.545 Interest Rate Futures Treasury Bonds (CBT) $100,000: pts 32nds of 100% Juno 147-280 148-170 147-230 148-070 70 941,582 Treasury Notes (CBT) $100,000, pts 32nds of 100% June 123-190 123 295 123-170 123-255 5,0 3,920,30G Sopt 123-305 124-040 123-270 124.015 60 2.121 5 Y. Treasury Notes (CBT) $100,000, pts 32nds of 100% June 115-150 115 230 115-147 115-202 3.5 4.272721 Sept 115.220 115.252 115-202 115-240 4.0 41.922 2 Y. Treasury Notes (CBT) $200,000, pts 32nds of 100% June 106-123 106-147 106-122 106-135 1.0 3.407.265 30 Day Federal Funds (CBT) $5,000,000.100 daily avg Apre 97.590 97 593 97,590 97.590-002 222,888 May 97,600 97 600 97.595 97.595 005 264,957 10 Yr. Dol. Int. Rate Swaps (CBT) $100.000: pts 32nds of 100% June 104.406 104.797 104 405 104641 188 19922 1 Month Libor CME) 51300.000, pts of 100% April 97.5225 15 Eurodotta (CME)-51000.000, pts of 100% April 974275 97.4275 97.4100 97.4175 - 0125 225.024 June 97 4450 97 4550 974400 97.4450 - 0050 1.450,756 Sept 97.40597 5050 974810 97/4950 1385 215 Ded 97 SOSO 9735 9750GO 975200 0050 1,653,693 MY 2.742 Currency Futures Japanese Yen CME) 12.500.000 per 100 April 990 9016 3992 June 9067 0970 0015 9059 0010 0009 2,490 101.102 9034 7507 -7518-0001 1,031 141,631 May 1.75 553,142 2.25 556,095 1.3087 1.3128 0041 0041 815 139,407 -2.25 -1.00 3,102 1.875 1.0038 -0031 1.0123 -0032 74,074 48 3.25 267,825 3.50 261.722 Om www. April 7508 .7508 .7505 June 7514 .7528 .7497 British Pound (CMEM 62,500, 5 perc April 1.3054 1.3118 1.3052 June 1.3097 1.3165 1.3093 Swiss Franc (CME)-CHF 125,500: per CHF June 1.0067 1.0075 1.0030 Sopt 1.0122 10130 1.0117 Australian Dollar (CME) AUD 100,000, 5 per AUD April 7116 7164 7116 May 7127 7179 7117 June .7133 7185 7120 Sept .7146 7196 7140 Dec 7176 7187 7176 March 20 7172 7172 7163 Mexican Peso (CME)-MXN 500.000; S per MXN Apri 05272 05272 05272 he 05226 05259 05222 Euro (CME) C125,000. perc April 1.1271 1.1292 1.1241 June 1.1328 11MO 11294 May 1.00 142.987 1.00 149.225 7167 .7171 7176 7189 7203 7216 0042 0042 0042 0041 .0041 0041 255 312 144.937 670 203 73 .03 127.952 03 158,428 -5.50 -250 5.281 2.162 05303 .00026 05251 00026 Agriculture Futures Corn (CBT)-5,000 bu, cents per bu 360.25 362.75 360.00 361.75 July 368.75 371.75 368.75 370.75 Oats (CBT)-5,000 bu, cents per bu. May 282.00 282.00 277.00 279.00 July 274.25 274.75 269.75 272.75 Soybeans (CBT)-5,000 buscents per bu. May 898.75 903.75 897.25 902.00 July 911.50 917.00 910.25 915.25 Soybean Meal (CBT)-100 tons. per ton. 309.10 311.00 308.50 310.10 July 312.80 314.70 312.20 313.80 Soybean Oll (CBT) 60,000 lbs: cents per lb. May 29.02 29.11 28.81 29.07 July 29.31 29.41 29.12 29.38 Rough Rice (CBT)2000 cwt: Sper cwb. May 1032.00 1041.50 1021.50 1023.50 July 1059.00 1061.50 1042.00 1048.50 Wheat (CBT) 5000 bucents per bu. May 459.00 461.75 455.50 458.00 July 463.75 464.75 460.00 461.50 Wheat (KC)-5000 bu, cents per bu 426.75 430.00 424.50 426.25 JU 433.50 43625 431.50 432.75 Wheat (MPLS) 5000 buscents per bu May 523.00 533:50 52300 530.25 July 53100 541 25 53100 537.00 Cattle-Feeder CME) 50,000 inscents poti Apni 145.850 145.925 145.00 145 175 AUD 157.600 157 750 156.450 157025 Cattie-UV (CME) 40,000 toscents por April 125 825 126 325 125 375 125 875 June 120 150 120.350 119.600 119.950 Hogs-Lean CME) 40.000 lbs. cents perib Aprill 78.750 79.125 78.675 78.900 June 94.000 97325 93525 96.450 Lumber ICME) 110,000 bdit per 1000 bd. May 362.00 344.80 335.00 342.40 July 346.30 340 10 340.80 345 00 Mik (CME-200.000 lbscents per 1594 15.99 15 87 15.07 May 15.84 1506 15 84 15.92 Coco CE USI 10 metrictons perton 39 234,619 -1.50 158.124 -2.50 171,832 1.1276 1.1335 0003 0003 2,397 478.245 May -1.25 117401 -2.25 125.262 7.25 5.75 21.552 21.016 -975 3.781 575 18,169 -025 23.370 400 198 207 Index Futuros MIN DJ industrial Average (CBT) 5 index June 26140 26233 26107 26166 78.612 SAP 500 index CM-5050 Index June 288300289550 A 2883.00 2894.50 1190 28.438 Mini S&P 500 (CME) 550 index June 2882002995.75 2878.00 2894 50 12.00 2.531,776 Seal 2887.75 2001.00 288350 2899,50 12.00 19 300 MINI SSP Midcap 400 (CME) $100 Index June 1932 20 1951.50 1929.00 1949.40 18.30 63.577 Mol Nasdaq 100 CME) 320 X index June 75905 76460 75753 76413 400 200.115 Min Russell 2000 ICE US) $100 Index June 1564,50 1526 80 1562.10 1585.30 2110 435.357 Mint Russell 1000 TCE US):5100 index June 1596.20 1603 1596.40 1603.00 8.979 US Dollar Index (CEUS 51000 index 375 1300 13.520 $2.000 2.40 70 1.880 1016 ADI 3.190 02 02 3178 28.81 .03 127,952 03 158,428 7203 .7216 0041 .0041 203 73 -5.50 -2.50 5.281 2.162 Juno Dec 7176 7187 7176 March 20 7172 7172 7163 Mexican Peso (CME) MXN 500,000: S per MXN April 05272 05272 05272 05226 05259 05222 Euro (CME) C125,000Spore April 1.1271 1.1292 1.1241 June 1.1328 1.1360 1.1294 .05303 .00026 05251 00026 39 234,619 -1.50 158,124 -2.50 171,832 1.1276 0003 1.1336 0003 2,387 478,245 -1.25 117401 -2.25 125.262 7.25 5.75 21.552 21,816 -975 575 3,781 18.169 -025 23.376 - 400 198.207 May 29.02 29.11 29.07 July 29.31 29.41 29.12 29.38 Rough Rice (CBT)-2000 cw; per cwb. May 1032.00 1041.50 1021.50 1023.50 July 1059.00 1061.50 1042.00 1048.50 Wheat (CBT)-5000 bu: cents per bu. May 459.00 461.75 455.50 458.00 July 463.75 464.75 460.00 461.50 Wheat (KC)-5000 bu, cents per bu May 426.75 430.00 424.50 426.25 July 433.50 436.25 431.50 432.75 Wheat (MPLS)-5000 bu; cents per bu May 523.00 533.50 523.00 530.25 July 53100 541.25 531.00 537.00 Cattle-Feeder (CME) 50,000 lbs.: cents per ib. April 145.850 145.925 145.00 145.175 Aug 157.600 157.750 156.450 157.025 Cattie Live (CME) 40,000 lbs: cents per i April 125.825 126.325 125.375 125.875 June 120.150 120.350 119.600 119.950 Hogs-Lean CME) 40,000 lbs. cents per i April 78.750 79.125 78.675 78.900 June 34.000 97.325 93.525 96.450 Lumber (CME-110,000 bd.fl. per 1.000 bd. May 342.30 344 80 336.00 342.40 July 346 30 348. 10 y 340 80 345.00 MIK (CME). 200,000 lbs: cents per i April 15.94 15.99 A 15.87 15.07 15.84 15.96 A 15.84 15.92 Cocoa (CE-US)-10 metrictons, Sporton May 2.439 2.449 2,421 2.443 July 2418 2.425 2,399 Coffee CEUS)-37,500 los cents per ib. May 93.75 94.50 93.10 04.25 July 9620 96.95 95.60 96.75 Sugar World (CE-US112.000 lbs cents por ib. May 12.78 1283 12.70 1281 12.00 12.99 12.34 12.98 Sugar Domestic OCE-US)-112,000 lbs: cents per i July 26.99 27.00 26.99 Sopt 26.65 26.95 26 65 27.10 Index Futuros Mini DJ Industrial Average (CBT-$5 x index June 26144 26233 26107 26166 8 78.612 S&P 500 Index (CME) $250 x Index une 2883.00 2895.50 A 2883.00 2894.50 11.90 28438 Mini S&P 500 (CME) $50 x Index June 2882.00 2895.75 2878.00 2894.50 12.00 2.531,776 Sept 2887.75 2901.00 2883.50 2899,50 12.00 19.300 Mini SAP Midcap 400 (CME) $100 Index Juno 1932.20 1951.50 1929.00 1949.40 18.30 63,577 Mint Nasdaq 100 (CME)-520 x Index June 75905 76460 A 7575.8 26413 48.0 200.115 Mini Russell 2000 LICE-US) 5100 x index June 1564.50 1586.30 1562.10 1585,80 21.10 435,857 Mini Russell 1000 (CEUS) $100 x Index JUN 1599.70 1603 40 1598.40 1603.00 6.30 8,979 US Dollar Index (CE-US-$1.000 x Index June 9660 96.84 96.41 96.56 05 49 450 375 1.300 13.520 82006 240 70 1.880 1016 02 07 3,396 3878 -3 5 21.910 88.143 60 90442 65 115.156 03 230.257 08 209,402 27.00 39 44 2.759 2,456
Step by Step Solution
There are 3 Steps involved in it

Get step-by-step solutions from verified subject matter experts