

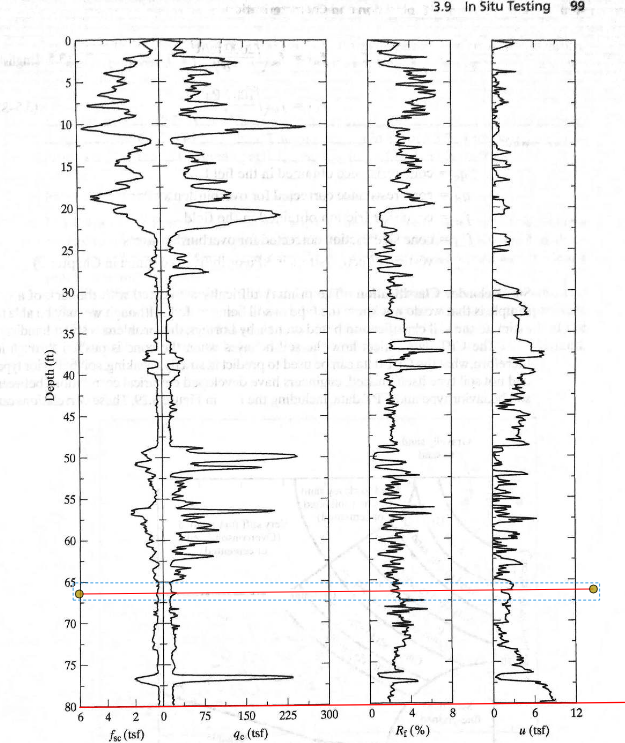
Question: Using Figure 3 . 2 9 , classify the soils between depths of 6 6 and 8 0 ft in the CPT results pre -
Using Figure classify the soils between depths of and ft in the CPT results pre sented in Figure Why are there spikes in the q f and R; curves between depths of and ft Please explaiun how to read the graph using lines because I am not getting the right answers In Situ Testing
Step by Step Solution
There are 3 Steps involved in it
1 Expert Approved Answer
Step: 1 Unlock

Question Has Been Solved by an Expert!
Get step-by-step solutions from verified subject matter experts
Step: 2 Unlock
Step: 3 Unlock