

Question: Using formulas and writing them down on paper. Not supposed to use Excel PG&E Corporation (Ticker symbol PCG) engages in the sale and delivery of
Using formulas and writing them down on paper. Not supposed to use Excel
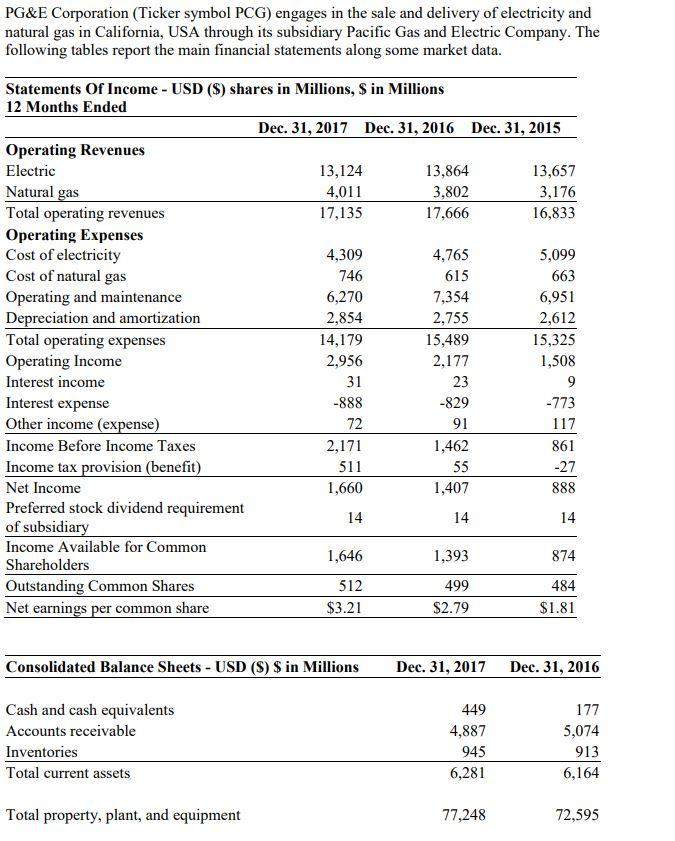
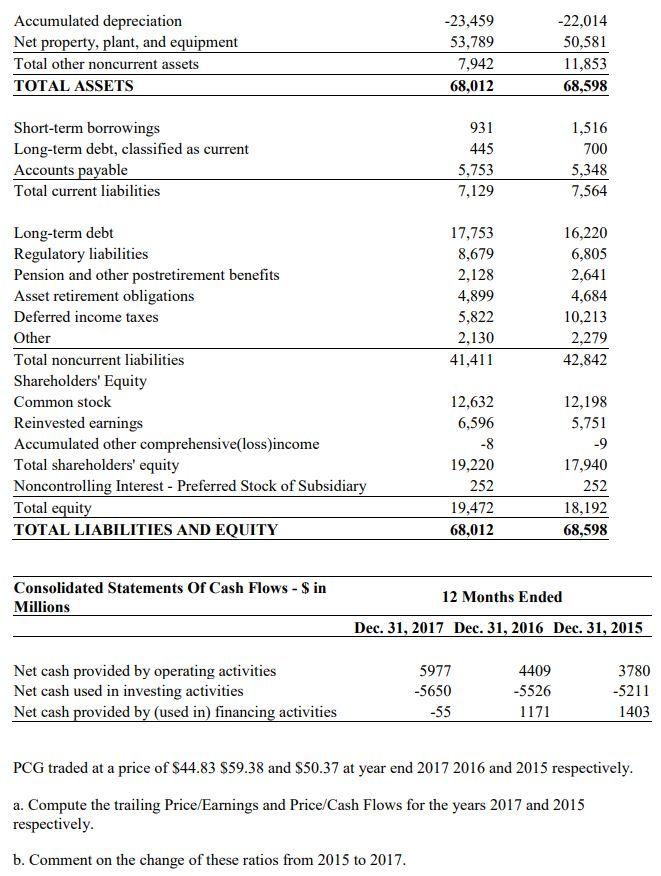
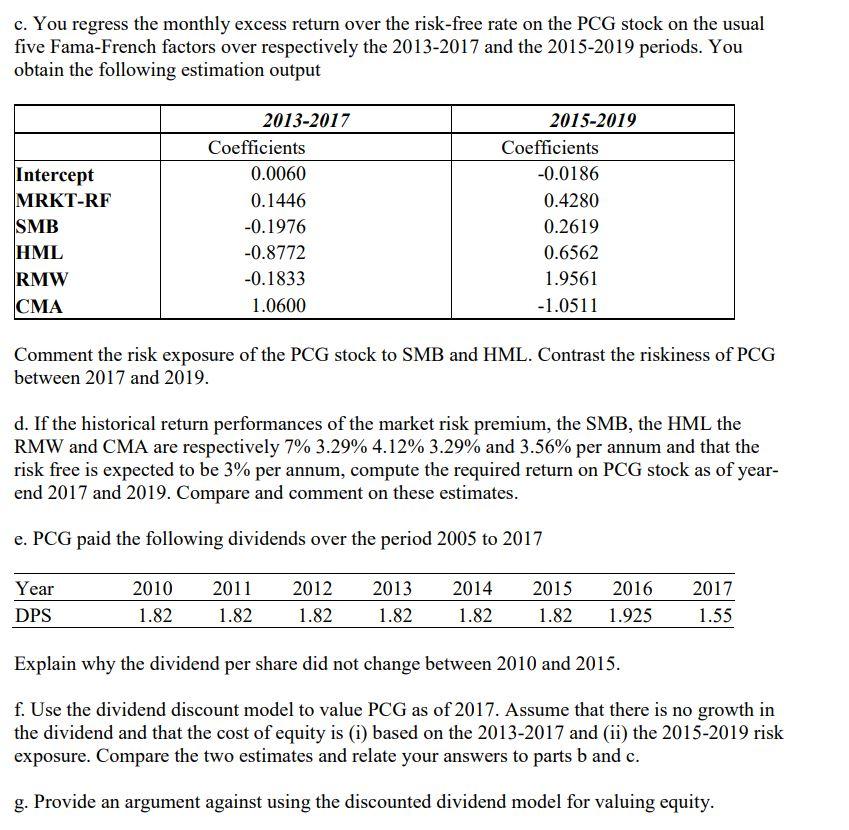
PG&E Corporation (Ticker symbol PCG) engages in the sale and delivery of electricity and natural gas in California, USA through its subsidiary Pacific Gas and Electric Company. The following tables report the main financial statements along some market data. Statements Of Income - USD ($) shares in Millions, $ in Millions 12 Months Ended Dec. 31, 2017 Dec. 31, 2016 Dec. 31, 2015 Operating Revenues Electric 13,124 13,864 13,657 Natural gas 4,011 3,802 3,176 Total operating revenues 17,135 17,666 16,833 Operating Expenses Cost of electricity 4,309 4,765 5,099 Cost of natural gas 746 615 663 Operating and maintenance 6,270 7,354 6,951 Depreciation and amortization 2,854 2,755 2,612 Total operating expenses 14,179 15,489 15,325 Operating Income 2,956 2,177 1,508 Interest income 31 23 9 Interest expense -888 -829 -773 Other income (expense) 72 91 117 Income Before Income Taxes 2,171 1,462 861 Income tax provision (benefit) 511 55 -27 Net Income 1,660 1,407 888 Preferred stock dividend requirement 14 14 14 of subsidiary Income Available for Common 1,646 1,393 874 Shareholders Outstanding Common Shares 512 499 484 Net earnings per common share $3.21 $2.79 $1.81 Consolidated Balance Sheets - USD ($) $ in Millions Dec. 31, 2017 Dec. 31, 2016 Cash and cash equivalents Accounts receivable Inventories Total current assets 449 4,887 945 6,281 177 5,074 913 6,164 Total property, plant, and equipment 77,248 72,595 Accumulated depreciation Net property, plant, and equipment Total other noncurrent assets TOTAL ASSETS -23,459 53,789 7,942 68,012 -22,014 50,581 11,853 68,598 Short-term borrowings Long-term debt, classified as current Accounts payable Total current liabilities 931 445 5,753 7,129 1,516 700 5,348 7,564 17,753 8,679 2,128 4,899 5,822 2,130 41,411 16,220 6,805 2,641 4,684 10,213 2,279 42,842 Long-term debt Regulatory liabilities Pension and other postretirement benefits Asset retirement obligations Deferred income taxes Other Total noncurrent liabilities Shareholders' Equity Common stock Reinvested earnings Accumulated other comprehensive(loss)income Total shareholders' equity Noncontrolling Interest - Preferred Stock of Subsidiary Total equity TOTAL LIABILITIES AND EQUITY 12,632 6,596 -8 19,220 252 19,472 68,012 12,198 5,751 -9 17,940 252 18,192 68,598 Consolidated Statements Of Cash Flows - $ in Millions 12 Months Ended Dec. 31, 2017 Dec. 31, 2016 Dec. 31, 2015 Net cash provided by operating activities Net cash used in investing activities Net cash provided by (used in) financing activities 5977 -5650 -55 4409 -5526 1171 3780 -5211 1403 PCG traded at a price of $44.83 $59.38 and $50.37 at year end 2017 2016 and 2015 respectively. a. Compute the trailing Price/Earnings and Price/Cash Flows for the years 2017 and 2015 respectively. b. Comment on the change of these ratios from 2015 to 2017. c. You regress the monthly excess return over the risk-free rate on the PCG stock on the usual five Fama-French factors over respectively the 2013-2017 and the 2015-2019 periods. You obtain the following estimation output Intercept MRKT-RF SMB HML RMW 2013-2017 Coefficients 0.0060 0.1446 -0.1976 -0.8772 -0.1833 1.0600 2015-2019 Coefficients -0.0186 0.4280 0.2619 0.6562 1.9561 -1.0511 Comment the risk exposure of the PCG stock to SMB and HML. Contrast the riskiness of PCG between 2017 and 2019. d. If the historical return performances of the market risk premium, the SMB, the HML the RMW and CMA are respectively 7% 3.29% 4.12% 3.29% and 3.56% per annum and that the risk free is expected to be 3% per annum, compute the required return on PCG stock as of year- end 2017 and 2019. Compare and comment on these estimates. e. PCG paid the following dividends over the period 2005 to 2017 Year DPS 2010 1.82 2011 1.82 2012 1.82 2013 1.82 2014 1.82 2015 1.82 2016 1.925 2017 1.55 Explain why the dividend per share did not change between 2010 and 2015. f. Use the dividend discount model to value PCG as of 2017. Assume that there is no growth in the dividend and that the cost of equity is (i) based on the 2013-2017 and (ii) the 2015-2019 risk exposure. Compare the two estimates and relate your answers to parts b and c. g. Provide an argument against using the discounted dividend model for valuing equity. PG&E Corporation (Ticker symbol PCG) engages in the sale and delivery of electricity and natural gas in California, USA through its subsidiary Pacific Gas and Electric Company. The following tables report the main financial statements along some market data. Statements Of Income - USD ($) shares in Millions, $ in Millions 12 Months Ended Dec. 31, 2017 Dec. 31, 2016 Dec. 31, 2015 Operating Revenues Electric 13,124 13,864 13,657 Natural gas 4,011 3,802 3,176 Total operating revenues 17,135 17,666 16,833 Operating Expenses Cost of electricity 4,309 4,765 5,099 Cost of natural gas 746 615 663 Operating and maintenance 6,270 7,354 6,951 Depreciation and amortization 2,854 2,755 2,612 Total operating expenses 14,179 15,489 15,325 Operating Income 2,956 2,177 1,508 Interest income 31 23 9 Interest expense -888 -829 -773 Other income (expense) 72 91 117 Income Before Income Taxes 2,171 1,462 861 Income tax provision (benefit) 511 55 -27 Net Income 1,660 1,407 888 Preferred stock dividend requirement 14 14 14 of subsidiary Income Available for Common 1,646 1,393 874 Shareholders Outstanding Common Shares 512 499 484 Net earnings per common share $3.21 $2.79 $1.81 Consolidated Balance Sheets - USD ($) $ in Millions Dec. 31, 2017 Dec. 31, 2016 Cash and cash equivalents Accounts receivable Inventories Total current assets 449 4,887 945 6,281 177 5,074 913 6,164 Total property, plant, and equipment 77,248 72,595 Accumulated depreciation Net property, plant, and equipment Total other noncurrent assets TOTAL ASSETS -23,459 53,789 7,942 68,012 -22,014 50,581 11,853 68,598 Short-term borrowings Long-term debt, classified as current Accounts payable Total current liabilities 931 445 5,753 7,129 1,516 700 5,348 7,564 17,753 8,679 2,128 4,899 5,822 2,130 41,411 16,220 6,805 2,641 4,684 10,213 2,279 42,842 Long-term debt Regulatory liabilities Pension and other postretirement benefits Asset retirement obligations Deferred income taxes Other Total noncurrent liabilities Shareholders' Equity Common stock Reinvested earnings Accumulated other comprehensive(loss)income Total shareholders' equity Noncontrolling Interest - Preferred Stock of Subsidiary Total equity TOTAL LIABILITIES AND EQUITY 12,632 6,596 -8 19,220 252 19,472 68,012 12,198 5,751 -9 17,940 252 18,192 68,598 Consolidated Statements Of Cash Flows - $ in Millions 12 Months Ended Dec. 31, 2017 Dec. 31, 2016 Dec. 31, 2015 Net cash provided by operating activities Net cash used in investing activities Net cash provided by (used in) financing activities 5977 -5650 -55 4409 -5526 1171 3780 -5211 1403 PCG traded at a price of $44.83 $59.38 and $50.37 at year end 2017 2016 and 2015 respectively. a. Compute the trailing Price/Earnings and Price/Cash Flows for the years 2017 and 2015 respectively. b. Comment on the change of these ratios from 2015 to 2017. c. You regress the monthly excess return over the risk-free rate on the PCG stock on the usual five Fama-French factors over respectively the 2013-2017 and the 2015-2019 periods. You obtain the following estimation output Intercept MRKT-RF SMB HML RMW 2013-2017 Coefficients 0.0060 0.1446 -0.1976 -0.8772 -0.1833 1.0600 2015-2019 Coefficients -0.0186 0.4280 0.2619 0.6562 1.9561 -1.0511 Comment the risk exposure of the PCG stock to SMB and HML. Contrast the riskiness of PCG between 2017 and 2019. d. If the historical return performances of the market risk premium, the SMB, the HML the RMW and CMA are respectively 7% 3.29% 4.12% 3.29% and 3.56% per annum and that the risk free is expected to be 3% per annum, compute the required return on PCG stock as of year- end 2017 and 2019. Compare and comment on these estimates. e. PCG paid the following dividends over the period 2005 to 2017 Year DPS 2010 1.82 2011 1.82 2012 1.82 2013 1.82 2014 1.82 2015 1.82 2016 1.925 2017 1.55 Explain why the dividend per share did not change between 2010 and 2015. f. Use the dividend discount model to value PCG as of 2017. Assume that there is no growth in the dividend and that the cost of equity is (i) based on the 2013-2017 and (ii) the 2015-2019 risk exposure. Compare the two estimates and relate your answers to parts b and c. g. Provide an argument against using the discounted dividend model for valuing equity
Step by Step Solution
There are 3 Steps involved in it

Get step-by-step solutions from verified subject matter experts