

Question: Using frequency ( y axis ) and mark of class (x axis ) we obtained the histogram of sp500 returns interpret this histogram of
Using frequency ( y axis ) and mark of class (x axis ) we obtained the histogram of sp500 returns interpret this histogram of sp500 returns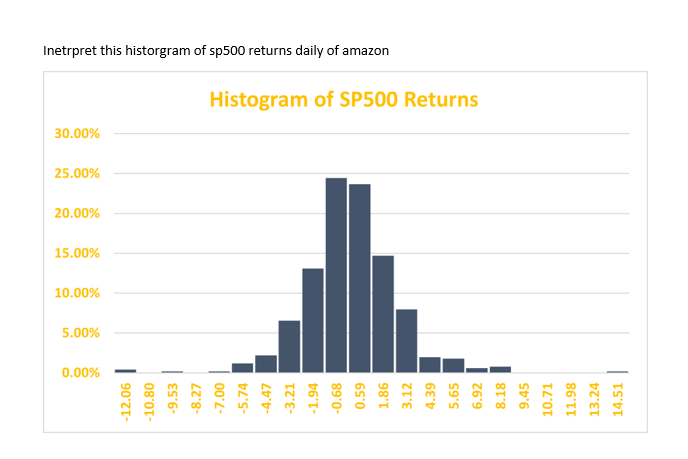
0.00% 30.00% 25.00% 20.00% 15.00% 10.00% 5.00% -12.06 -10.80 -9.53 -8.27 -7.00 -5.74 Inetrpret this historgram of sp500 returns daily of amazon Histogram of SP500 Returns -4.47 -3.21 -1.94 -0.68 0.59 1.86 3.12 4.39 5.65 6.92 8.18 9.45 10.71 11.98 13.24 14.51
Step by Step Solution
There are 3 Steps involved in it
Interpreting a histogram of SP 500 returns involves understanding the distribution of returns over a ... View full answer

Get step-by-step solutions from verified subject matter experts