

Question: Using Future Plan's commitment information (Exhibit 4) and the evolution of a typical primary PE fund offering (Exhibit 8a), model the expected NAV for Future
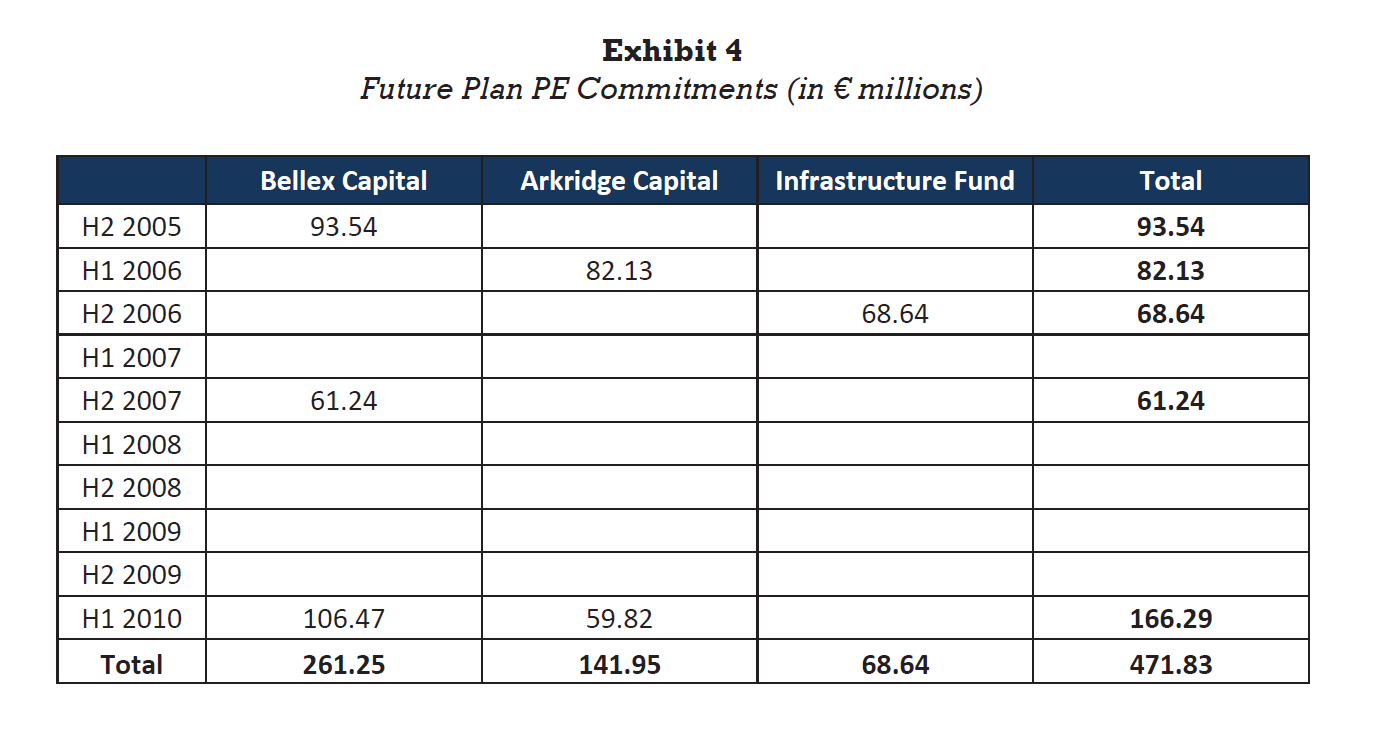
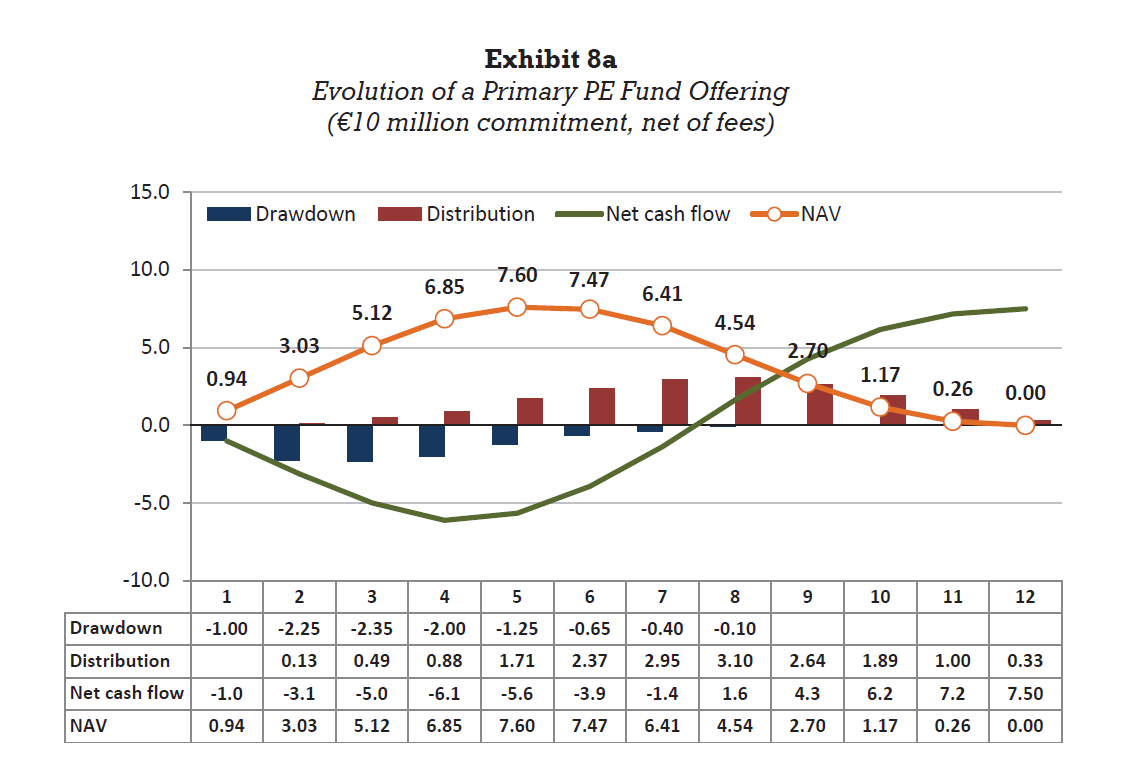
Using Future Plan's commitment information (Exhibit 4) and the evolution of a typical primary PE fund offering (Exhibit 8a), model the expected NAV for Future Plan's existing portfolio of PE investments as of year-end 2011. Was the evolution of Future Plan's actual exposure to the asset class in line with this projected value? If not, what may have contributed to the deviation?
Step by Step Solution
There are 3 Steps involved in it
1 Expert Approved Answer
Step: 1 Unlock

Question Has Been Solved by an Expert!
Get step-by-step solutions from verified subject matter experts
Step: 2 Unlock
Step: 3 Unlock