

Question: Using GPOWER software calculate the estimated sample size needed when given these factors: A Priori Power Analysis Download the G*Power software provided, and then use
Using GPOWER software calculate the estimated sample size needed when given these factors:
A Priori Power Analysis
Download the G*Power software provided, and then use the software to submit the following:
Part I
Calculate the estimated sample size needed when given these factors:
- one-tailed t-test with two independent groups of equal size
- small effect size (see Piasta, S.B., & Justice, L.M., 2010)
- alpha =.05
- beta = .2 (Reminder: Power = 1 - beta)
Part II
Assume that the result is a sample size beyond what you can obtain. Use the compromise function to compute alpha and beta for a sample half the size.
- Indicate the resulting alpha and beta.
- Analyze the result and decide if the study should be conducted with smaller sample size. Explain your rationale.
- In the context of Type I and Type II errors.
- Include a visual of the G* Power output matrix.
Answers:
Part I is shown in the screenshot below.
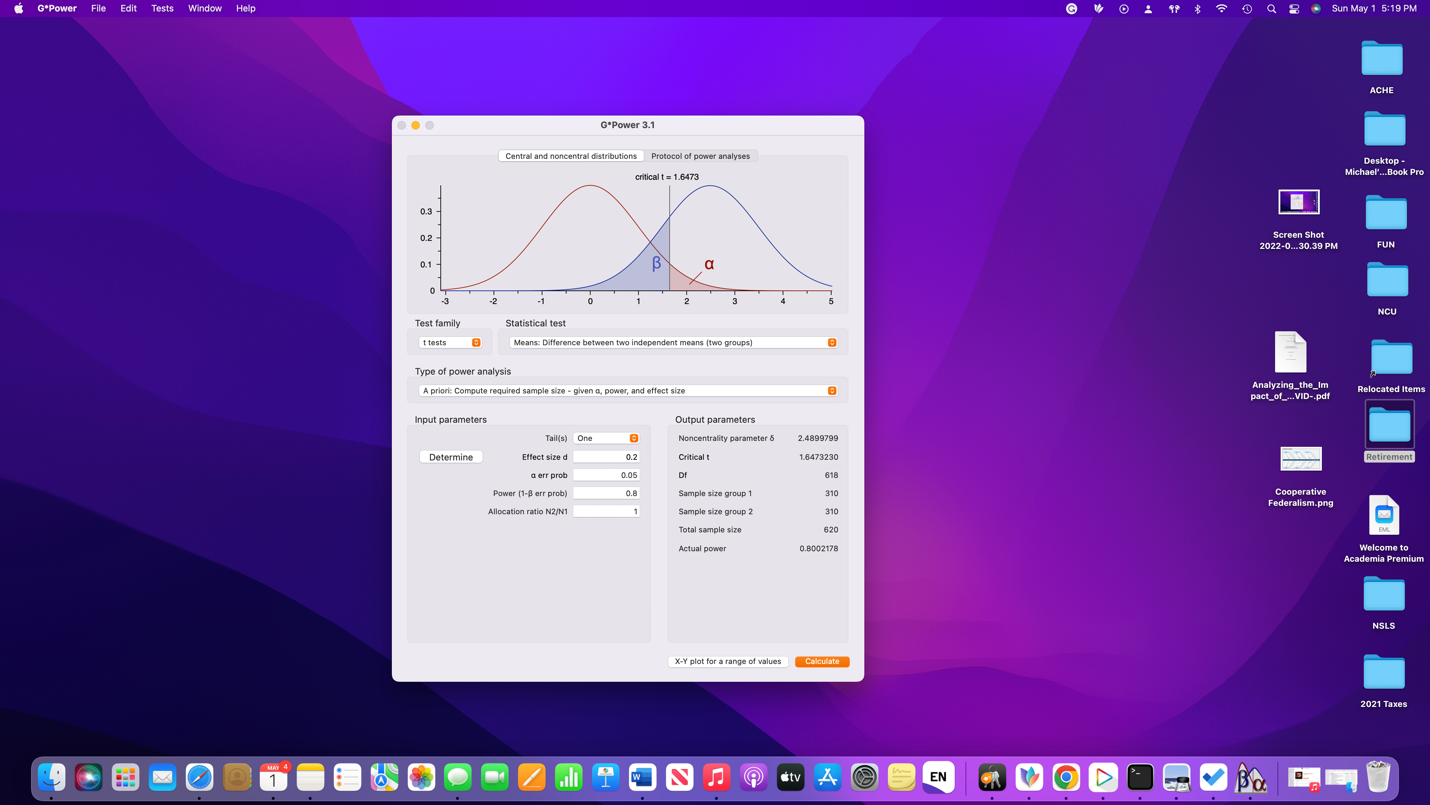
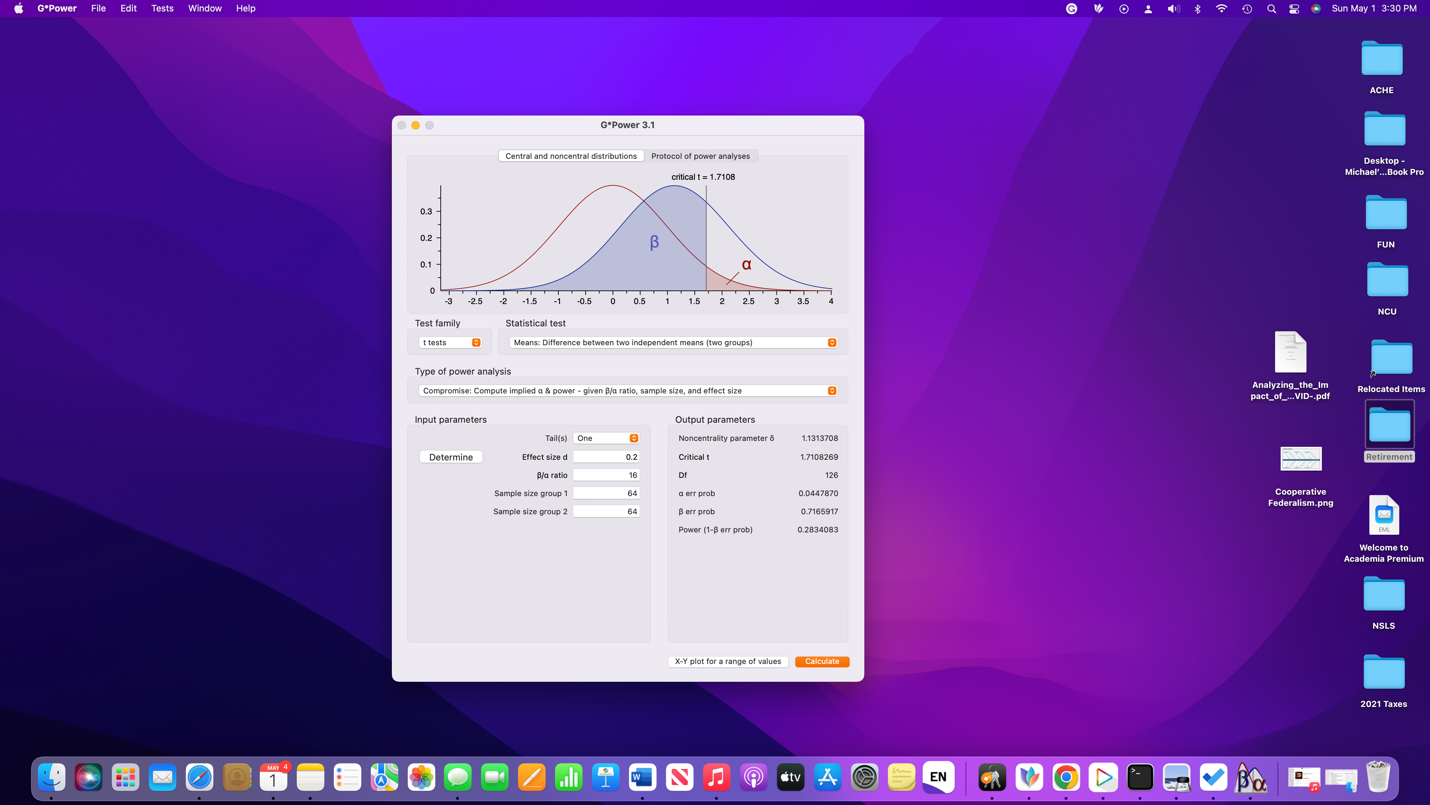
G.Power File Edit Tests Window Help 0 : 19 8 70 9 8 0 Sun May 1 5:19 PM ACHE G*Power 3.1 Central and noncentral distributions Protocol of power analyses Desktop - critical t = 1.6473 Michael'...Book Pro 0.3 0.2 Screen Shot 2022-0...30.39 PM FUN 0.1 B a 0 -2 3 NCT Test family Statistical test t tests Means: Difference between two independent means (two groups) Type of power analysis A priori: Compute required sample size - given a, power, and effect size E Analyzing_the_Im Relocated Items pact_of_...VID-.pdf Input parameters Output parameters Tail(s) One Noncentrality parameter 5 2.4899799 Determine Effect size d 0.2 Critical t 1.6473230 Retirement a err prob 0.05 Of 618 Power (1- err prob) 0.8 Sample size group 1 310 Cooperative Federalism.png Allocation ratio N2/N1 Sample size group 2 310 Total sample size 620 Actual power 0.8002178 Welcome to Academia Premium NSLS X-Y plot for a range of values Calculate 2021 Taxes A ENG.Power File Edit Tests Window Help (1 8 7 0 Q 2 0 Sun May 1 3:30 PM ACHE G*Power 3.1 Central and noncentral distributions Protocol of power analyses Desktop - critical t = 1.7108 Michael'...Book Pro 0.3 0.2 3 FUN 0.1 a -2.5 -2 -1.5 -1 -0.5 0 0.5 1 1.5 2 2.5 3 3.5 NCU Test family Statistical test t tests Means: Difference between two independent means (two groups) Type of power analysis Compromise: Compute implied a & power - given Bya ratio, sample size, and effect size E Analyzing_the_Im Relocated Items pact_of_...VID-.pdf Input parameters Output parameters Tail(s) One Noncentrality parameter 5 1.1313708 Determine Effect size d 0.2 Critical t 17108269 Retirement B/a ratio 16 Of 126 Sample size group 1 64 a err prob 0.0447870 Cooperative Federalism.png Sample size group 2 6A B err prob 0.7165917 Power (1-B err prob] 0.2834083 Welcome to Academia Premium NSLS X-Y plot for a range of values Calculate 2021 Taxes A EN
Step by Step Solution
There are 3 Steps involved in it

Get step-by-step solutions from verified subject matter experts