

Question: Using GUIGreet.java as a model, create a Java stand-alone GUI program that displays a Fahrenheit to Celsius temperature conversion table in an AWT Frame or
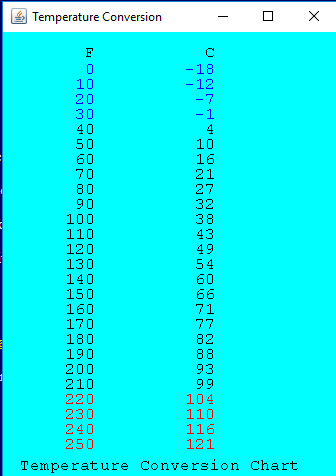
Using GUIGreet.java as a model, create a Java stand-alone GUI program that displays a Fahrenheit to Celsius temperature conversion table in an AWT Frame or a swing JFrame. The table should run from 0 degrees Fahrenheit to 250 degrees Fahrenheit, in steps of 10 degrees. Round the Celsius temperature values to the nearest integer.
Display any temperatures below the freezing point of water (32o Fahrenheit) in blue and any temperatures above the boiling point of water (212o Fahrenheit) in red (the rest in black).
The formula to use is:
Degrees Celsius = ( 5 9 ) ( Degrees Fahrenheit - 32 Degrees )
The program must be a stand-alone AWT or swing program, not an Applet or JApplet nor a JavaFx program. . .
It is not acceptable to pre-compute each Celsius value, and just have many g.drawString() statements. You need to use Java to calculate each value using the correct formula, and use various control structures.
The chart need not look like the sample.
Here is GUIgreet.java
// A stand-alone GUI Java program to display a friendly greeting. // Also added code to close the application when the user clicks // the mouse in the close box. import java.awt.*; import java.awt.event.*; public class GUIGreet extends Frame { private String message = "Hello, World!"; public GUIGreet () { setTitle( "A Friendly Greeting" ); setSize( 300, 200 ); setVisible( true ); addWindowListener( new WindowAdapter() { public void windowClosing( WindowEvent e ) { System.exit( 0 ); } } ); } public static void main ( String [] args ) { GUIGreet me = new GUIGreet(); } public void paint ( Graphics g ) { g.setColor( Color.RED ); g.drawRect( 30, 40, 240, 130 ); g.setColor( Color.BLUE ); g.setFont( new Font( "SansSerif", Font.BOLD, 24 ) ); g.drawString( message, 70, 110 ); // Position determined } // by trial and error! }Temperature Conversion -18 -12 10 20 3 0 40 50 60 70 80 90 100 110 120 130 140 150 160 170 180 190 200 210 220 230 240 250 1 10 16 21 27 32 38 43 4 9 5 4 60 71 82 93 104 110 116 121 Temperature Conversion Chart
Step by Step Solution
There are 3 Steps involved in it

Get step-by-step solutions from verified subject matter experts