

Question: Using historic sales data create a monthly forecast using classical decomposition that is based on regression and seasonality we are creating a monthly forecast not
Using historic sales data create a monthly forecast using classical decomposition that is based on regression and seasonality we are creating a monthly forecast not quarterly.
3 YEAR MONTHLY DATA
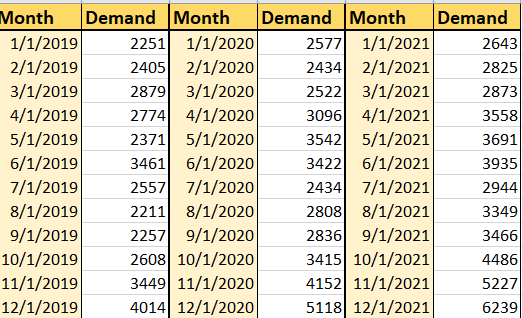
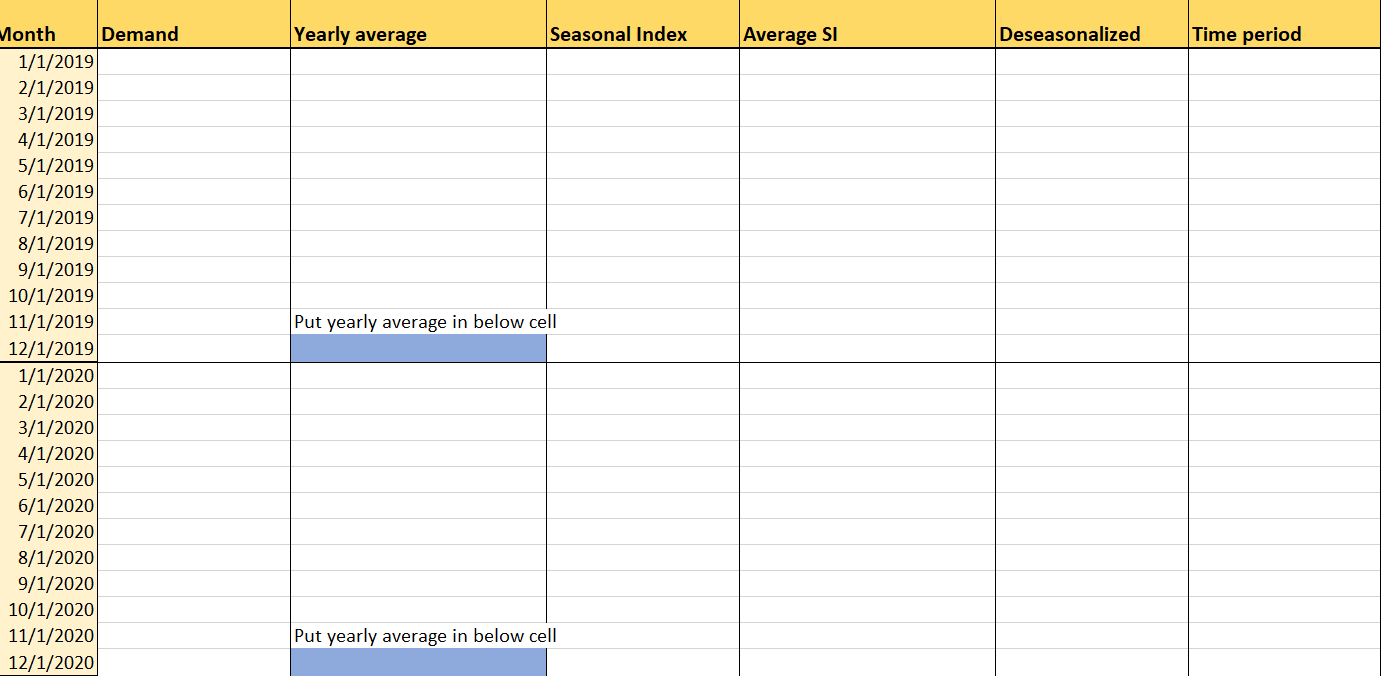
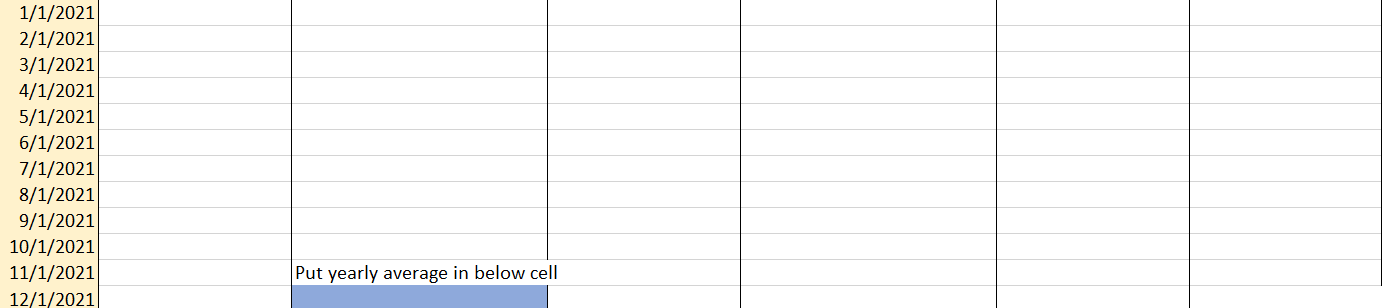
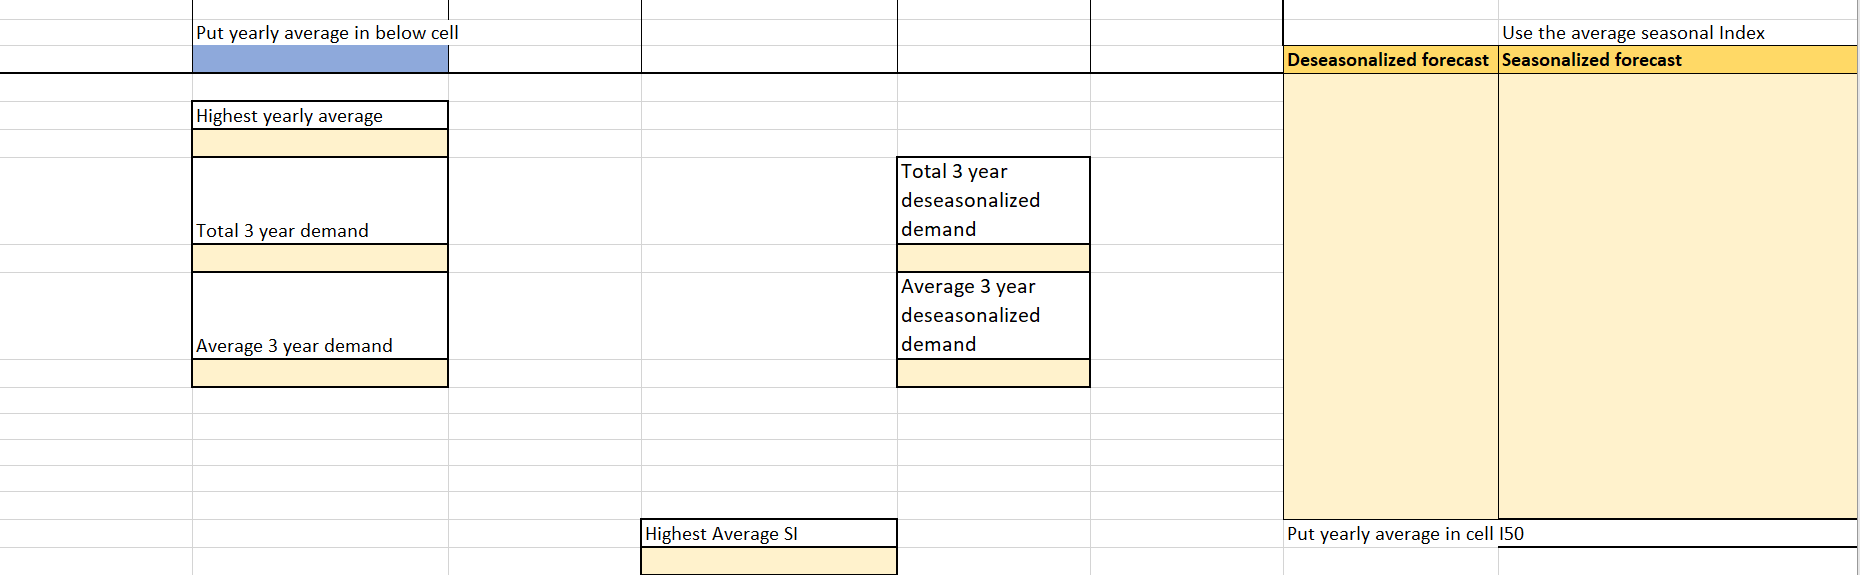
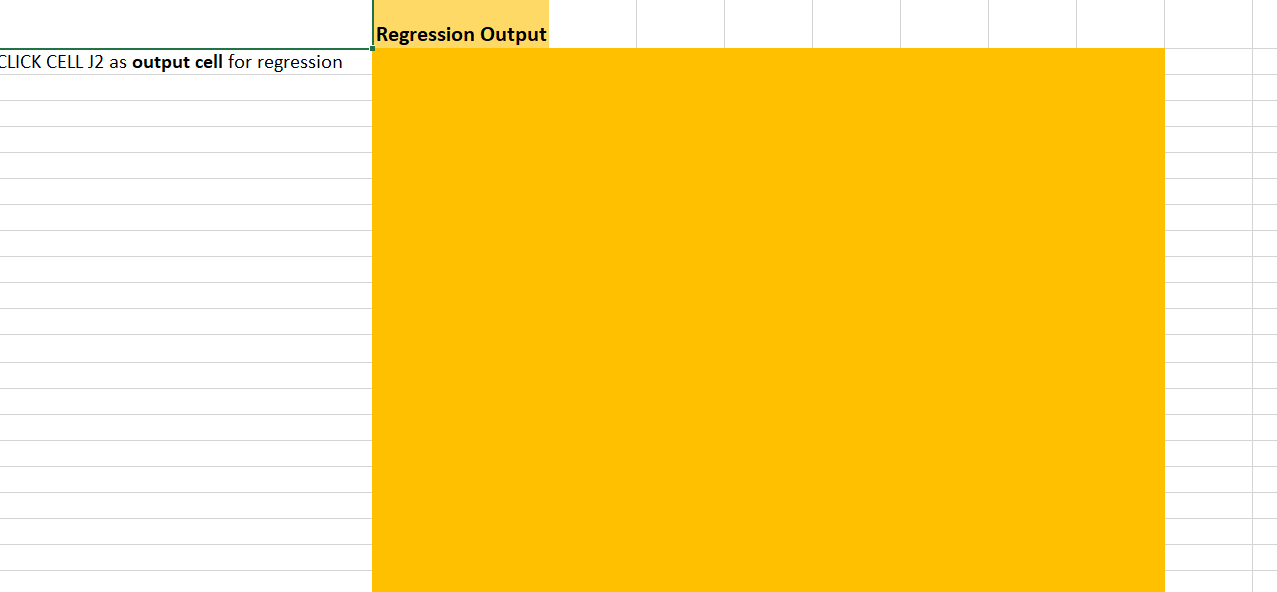
Month Demand Month Demand Month Demand 1/1/2019 2251 1/1/2020 2577 1/1/2021 2643 2/1/2019 2405 2/1/2020 2434 2/1/2021 2825 3/1/2019 2879 3/1/2020 2522 3/1/2021 2873 4/1/2019 2774 4/1/2020 3096 4/1/2021 3558 5/1/2019 2371 5/1/2020 3542 5/1/2021 3691 6/1/2019 3461 6/1/2020 3422 6/1/2021 3935 7/1/2019 2557 7/1/2020 2434 7/1/2021 2944 8/1/2019 2211 8/1/2020 2808 8/1/2021 3349 9/1/2019 2257 9/1/2020 2836 9/1/2021 3466 10/1/2019 2608 10/1/2020 3415 10/1/2021 4486 11/1/2019 3449 11/1/2020 4152 11/1/2021 5227 12/1/2019 4014 12/1/2020 5118 12/1/2021 6239) Yearly average Seasonal Index Average SI Deseasonalized Time period Put yearly average in below cell Month Demand 1/1/2019 2/1/2019 3/1/2019 4/1/2019 5/1/2019 6/1/2019 7/1/2019 8/1/2019 9/1/2019 10/1/2019 11/1/2019 12/1/2019 1/1/2020 2/1/2020 3/1/2020 4/1/2020 5/1/2020 6/1/2020 7/1/2020 8/1/2020 9/1/2020 10/1/2020 11/1/2020 12/1/2020 Put yearly average in below cell 1/1/2021 2/1/2021 3/1/2021 4/1/2021 5/1/2021 6/1/2021 7/1/2021 8/1/2021 9/1/2021 10/1/2021 11/1/2021 12/1/2021 Put yearly average in below cell Put yearly average in below cell Use the average seasonal Index Deseasonalized forecast Seasonalized forecast Highest yearly average Total 3 year deseasonalized demand Total 3 year demand Average 3 year deseasonalized demand Average 3 year demand Highest Average SI Put yearly average in cell 150 Regression Output CLICK CELL J2 as output cell for regression Month Demand Month Demand Month Demand 1/1/2019 2251 1/1/2020 2577 1/1/2021 2643 2/1/2019 2405 2/1/2020 2434 2/1/2021 2825 3/1/2019 2879 3/1/2020 2522 3/1/2021 2873 4/1/2019 2774 4/1/2020 3096 4/1/2021 3558 5/1/2019 2371 5/1/2020 3542 5/1/2021 3691 6/1/2019 3461 6/1/2020 3422 6/1/2021 3935 7/1/2019 2557 7/1/2020 2434 7/1/2021 2944 8/1/2019 2211 8/1/2020 2808 8/1/2021 3349 9/1/2019 2257 9/1/2020 2836 9/1/2021 3466 10/1/2019 2608 10/1/2020 3415 10/1/2021 4486 11/1/2019 3449 11/1/2020 4152 11/1/2021 5227 12/1/2019 4014 12/1/2020 5118 12/1/2021 6239) Yearly average Seasonal Index Average SI Deseasonalized Time period Put yearly average in below cell Month Demand 1/1/2019 2/1/2019 3/1/2019 4/1/2019 5/1/2019 6/1/2019 7/1/2019 8/1/2019 9/1/2019 10/1/2019 11/1/2019 12/1/2019 1/1/2020 2/1/2020 3/1/2020 4/1/2020 5/1/2020 6/1/2020 7/1/2020 8/1/2020 9/1/2020 10/1/2020 11/1/2020 12/1/2020 Put yearly average in below cell 1/1/2021 2/1/2021 3/1/2021 4/1/2021 5/1/2021 6/1/2021 7/1/2021 8/1/2021 9/1/2021 10/1/2021 11/1/2021 12/1/2021 Put yearly average in below cell Put yearly average in below cell Use the average seasonal Index Deseasonalized forecast Seasonalized forecast Highest yearly average Total 3 year deseasonalized demand Total 3 year demand Average 3 year deseasonalized demand Average 3 year demand Highest Average SI Put yearly average in cell 150 Regression Output CLICK CELL J2 as output cell for regression
Step by Step Solution
There are 3 Steps involved in it

Get step-by-step solutions from verified subject matter experts