

Question: Using information from both Exhibit 2 in the case and R&D expenses table (below), (1) calculate Research and Development (R&D) intensity in five segments (Game
Using information from both Exhibit 2 in the case and R&D expenses table (below), (1) calculate Research and Development (R&D) intensity in five segments (Game & Network Services, Home Entertainment & Sound, Imaging Products & Solutions, Mobile communications, Semiconductors) in 2017 and 2018, and then (2) identify the segments with highest R&D intensity in each year. (Note: R&D intensity = R&D expense Sales)
R&D Expenses (Yen in billions) R&D Intensity
| Segment | FY 2017 | FY 2018 | R&D Intensity FY 2017 (R&D Expense/Sales) | R&D Intensity FY 2018 (R&D Expense/Sales) |
| Game & Network Services | 95.6 | 106.2 |
|
|
| Home Entertainment & Sound | 47.3 | 58.0 |
| |
| Imaging Products & Solutions | 58.6 | 58.6 | ||
| Mobile Communications | 117.6 | 107.2 |
| |
| Semiconductors | 44.4 | 44.9 |
The segment with the highest R&D intensity in FY 2017 are:
The segment with the highest R&D intensity in FY 2018 are:
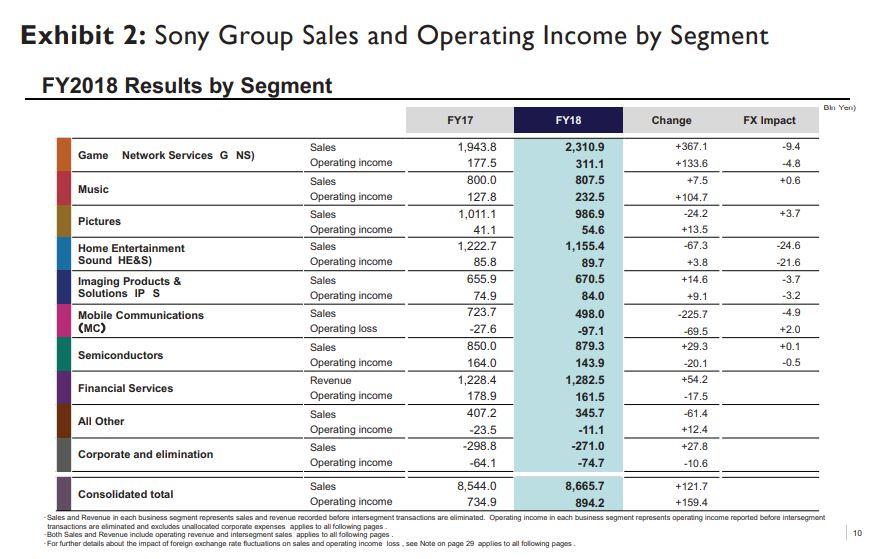
Exhibit 2: Sony Group Sales and Operating Income by Segment FY2018 Results by Segment
Step by Step Solution
There are 3 Steps involved in it

Get step-by-step solutions from verified subject matter experts