

Question: Using language R Use the table function to show the frequency distribution of the houses in your dataset based on the number of the bedrooms.
Using language R Use the table function to show the frequency distribution of the houses in your dataset based on the number of the bedrooms.
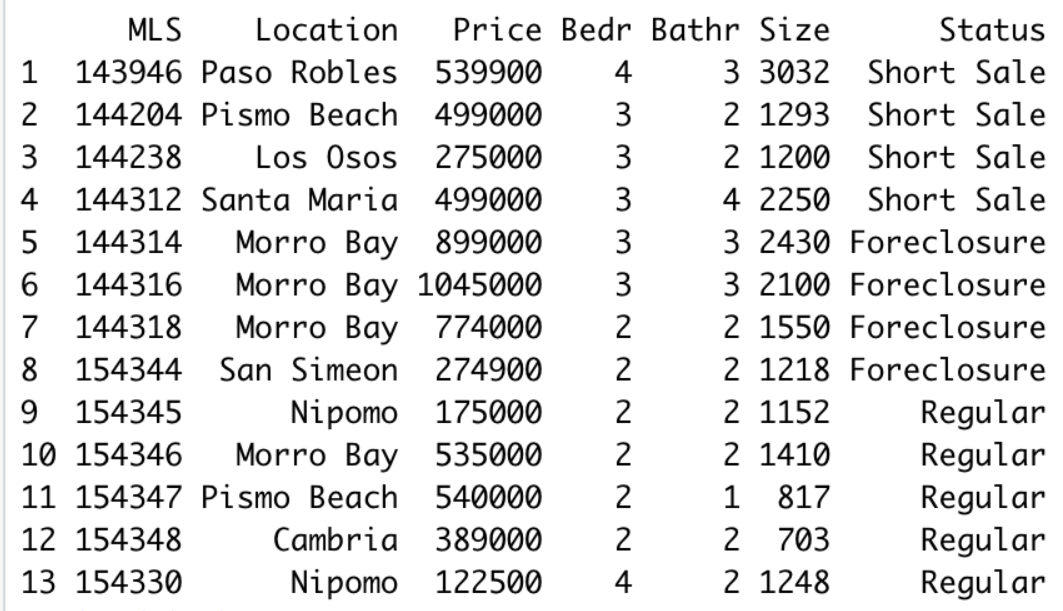
MLS Location Price Bedr Bathr Size Status 1 143946 Paso Robles 539900 4 3 3032 Short Sale 2 144204 Pismo Beach 499000 3 2 1293 Short Sale 3 144238 Los Osos 275000 3 2 1200 Short Sale 4 144312 Santa Maria 499000 3 4 2250 Short Sale 5 144314 Morro Bay 899000 3 3 2430 Foreclosure 6 144316 Morro Bay 1045000 3 3 2100 Foreclosure 7 144318 Morro Bay 774000 2 2 1550 Foreclosure 8 154344 San Simeon 274900 2 2 1218 Foreclosure 9 154345 Nipomo 175000 2 2 1152 Regular 10 154346 Morro Bay 535000 2 2 1410 Regular 11 154347 Pismo Beach 540000 2 1 817 Regular 12 154348 Cambria 389000 2 2 703 Regular 13 154330 Nipomo 122500 4 2 1248 Regular + N N N N N N w w w w w
Step by Step Solution
There are 3 Steps involved in it

Get step-by-step solutions from verified subject matter experts