

Question: Using MATBLAB, please explain steps Activity 1: Discrete Convolution (without the conv function) To illustrate the discrete time convolution we are going to use the
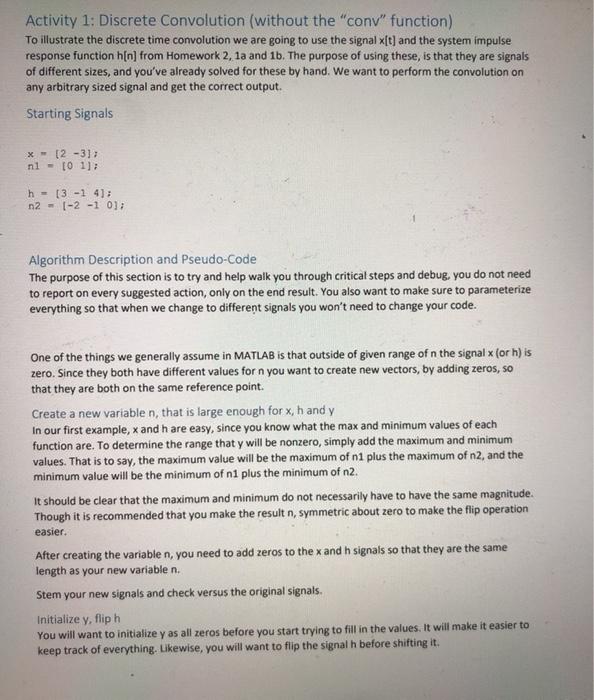
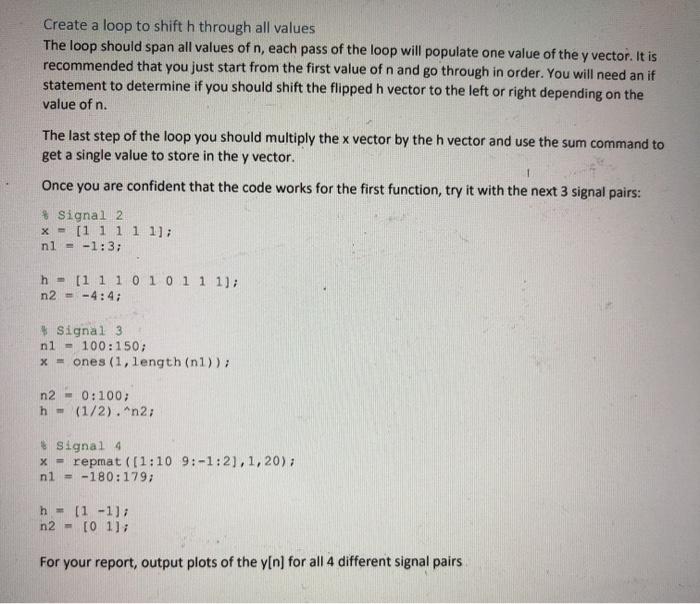
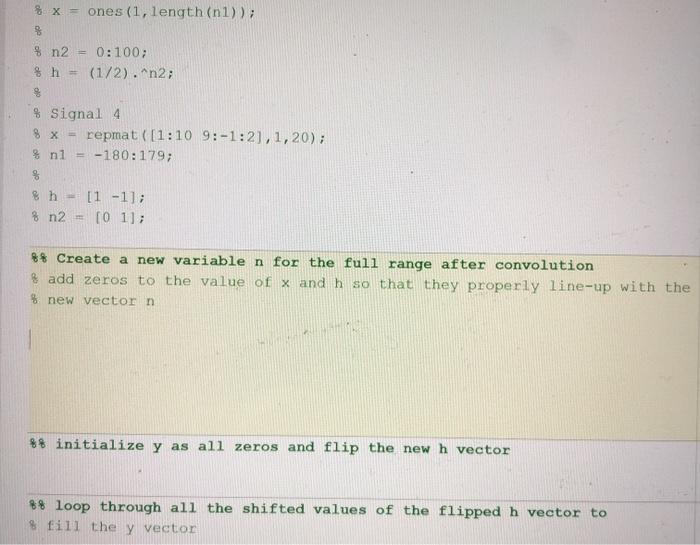
Activity 1: Discrete Convolution (without the "conv" function) To illustrate the discrete time convolution we are going to use the signal x[t) and the system impulse response function hin) from Homework 2, 1a and 1b. The purpose of using these, is that they are signals of different sizes, and you've already solved for these by hand. We want to perform the convolution on any arbitrary sized signal and get the correct output. Starting Signals x 12 -3]; nl - 10 1]; h = (3-14: n2 - 1-2 -1 0 Algorithm Description and Pseudo-Code The purpose of this section is to try and help walk you through critical steps and debug, you do not need to report on every suggested action, only on the end result. You also want to make sure to parameterize everything so that when we change to different signals you won't need to change your code. One of the things we generally assume in MATLAB is that outside of given range of n the signal x (or h) is zero. Since they both have different values for n you want to create new vectors, by adding zeros, so that they are both on the same reference point. Create a new variable n, that is large enough for x,h and y In our first example, and h are easy, since you know what the max and minimum values of each function are. To determine the range that y will be nonzero, simply add the maximum and minimum values. That is to say, the maximum value will be the maximum of 1 plus the maximum of n2, and the minimum value will be the minimum of ni plus the minimum of n2. It should be clear that the maximum and minimum do not necessarily have to have the same magnitude. Though it is recommended that you make the result n, symmetric about zero to make the flip operation easier. After creating the variable n, you need to add zeros to the x and h signals so that they are the same length as your new variable n. Stem your new signals and check versus the original signals. Initialize y, flip h You will want to initialize y as all zeros before you start trying to fill in the values. It will make it easier to keep track of everything. Likewise, you will want to flip the signal h before shifting it. Create a loop to shift h through all values The loop should span all values of n, each pass of the loop will populate one value of the y vector. It is recommended that you just start from the first value of n and go through in order. You will need an if statement to determine if you should shift the flipped h vector to the left or right depending on the value of n. The last step of the loop you should multiply the x vector by the h vector and use the sum command to get a single value to store in the y vector. Once you are confident that the code works for the first function, try it with the next 3 signal pairs: # Signal 2 x = [1 1 1 1 1]; nl = -1:3; h = [1 1101011 1); n2 - -4:4; * Signal 3 nl - 100:150; x = ones (1, length (nl)); n2 - 0:100; h - (1/2). "n2; Signal 4 x = repmat ([1:10 9:-1:21,1, 20); nl = -180:179; h = (1-1) n2 - [01]; For your report, output plots of the y[n) for all 4 different signal pairs % x = ones (1, length(n1)); 8 % n2 % h = 0:100; (1/2).^n2; $ Signal 4 8 x = repmat([1:10 9:-1:2), 1, 20); % n1 -180:179; 8 % h = [1 -1]; % n2 [O 1]; ** Create a new variable n for the full range after convolution & add zeros to the value of x and h so that they properly line-up with the % new vector n %% initialize y as all zeros and flip the new h vector 8% loop through all the shifted values of the flipped h vector to fill they vector
Step by Step Solution
There are 3 Steps involved in it

Get step-by-step solutions from verified subject matter experts