

Question: Using matlab 3. Ch 14--#Variation on 20 The Mystical River's water flow rate on a particular day is shown in the table below. The time
Using matlab 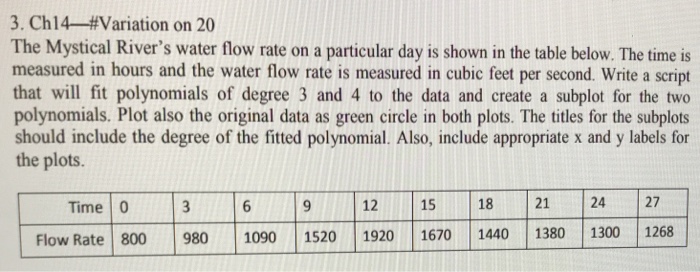
3. Ch 14--#Variation on 20 The Mystical River's water flow rate on a particular day is shown in the table below. The time is measured in hours and the water flow rate is measured in cubic feet per second. Write a script that will fit polynomials of degree 3 and 4 to the data and create a subplot for the two polynomials. Plot also the original data as green circle in both plots. The titles for the subplots should include the degree of the fitted polynomial. Also, include appropriate x and y labels for the plots. Time 0 12 15 18 21 24 27 Flow Rate 800 98 1090 1520 1920 1670 1440 1380 1300 1268
Step by Step Solution
There are 3 Steps involved in it
1 Expert Approved Answer
Step: 1 Unlock

Question Has Been Solved by an Expert!
Get step-by-step solutions from verified subject matter experts
Step: 2 Unlock
Step: 3 Unlock