

Question: Using MATLAB AppDesigner ,develop a program that can plot the graph of normal distribution interactively as shown in the figure: Make sure to Screenshot the
Using MATLAB AppDesigner ,develop a program that can plot the graph of normal distribution interactively as shown in the figure: 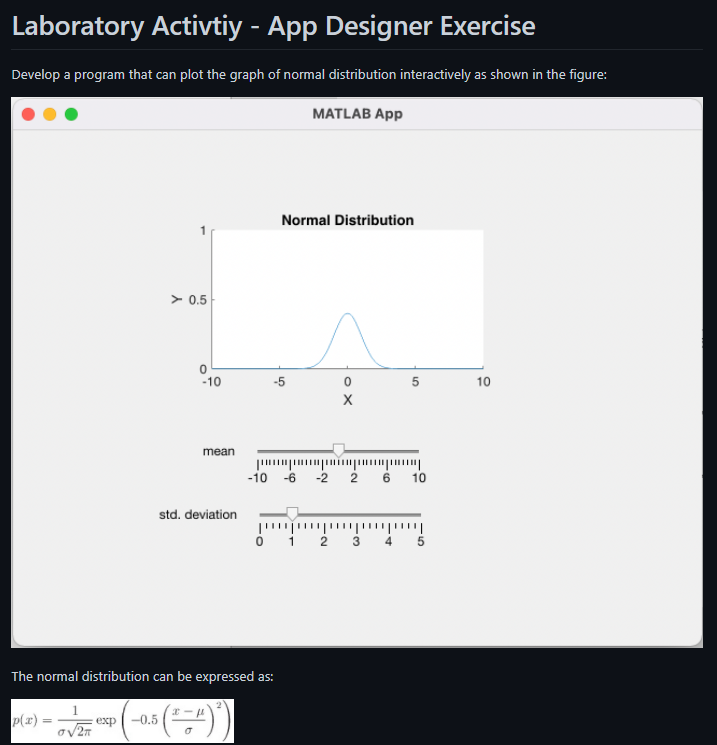
Make sure to Screenshot the codeview of the App
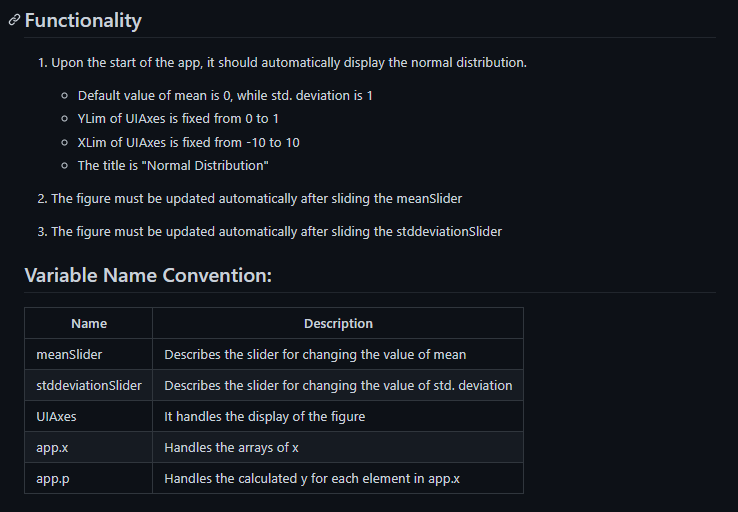
Laboratory Activtiy - App Designer Exercise Develop a program that can plot the graph of normal distribution interactively as shown in the figure: MATLAB App Normal Distribution > 0.5 0 -10 -5 5 10 mean -10 -6 -2 2 6 10 std. deviation 0 1 2 3 4 5 !" The normal distribution can be expressed as: p(2) VT exp-0.5 5(*^)) Functionality 1. Upon the start of the app, it should automatically display the normal distribution. o Default value of mean is 0, while std. deviation is 1 O YLim of UlAxes is fixed from 0 to 1 o XLim of UlAxes is fixed from - 10 to 10 The title is "Normal Distribution" 2. The figure must be updated automatically after sliding the meanSlider 3. The figure must be updated automatically after sliding the stddeviation Slider Variable Name Convention: Name Description meanSlider Describes the slider for changing the value of mean stddeviationSlider Describes the slider for changing the value of std. deviation UIAxes It handles the display of the figure app.x Handles the arrays of app.p Handles the calculated y for each element in app.x
Step by Step Solution
There are 3 Steps involved in it

Get step-by-step solutions from verified subject matter experts