

Question: Using MATLAB c. plot the data and the best-fit logistic regression model Challenger ORing: Use the Temperature and failure data from the Challenger O-rings in
Using MATLAB
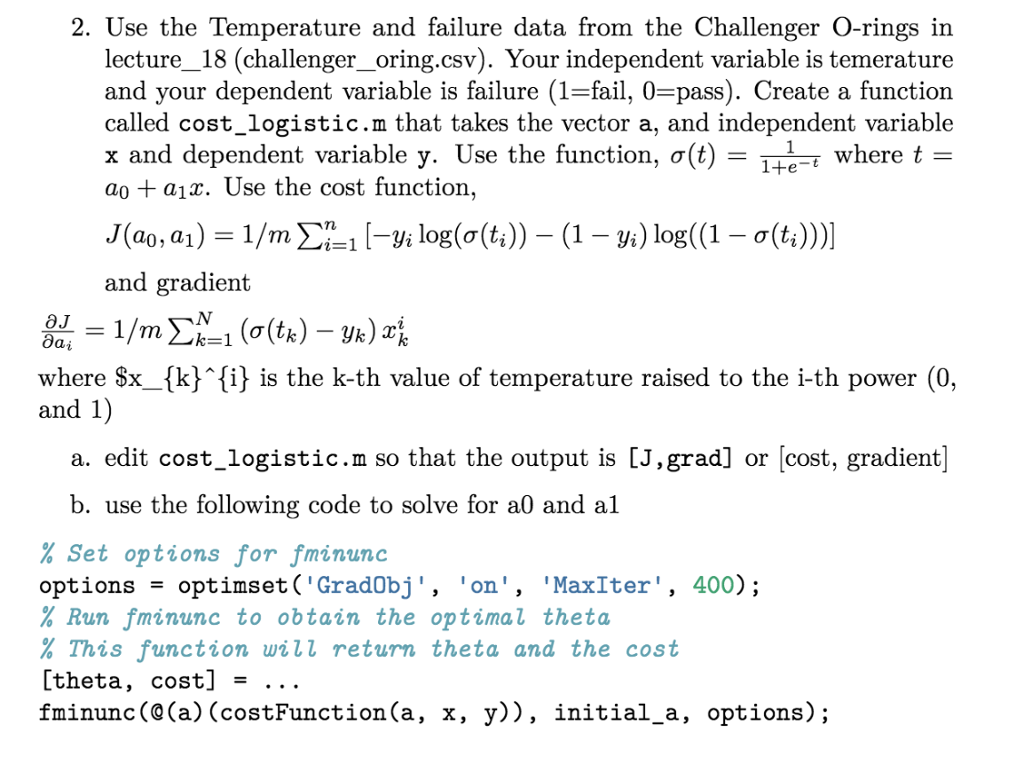
c. plot the data and the best-fit logistic regression model
Challenger ORing:
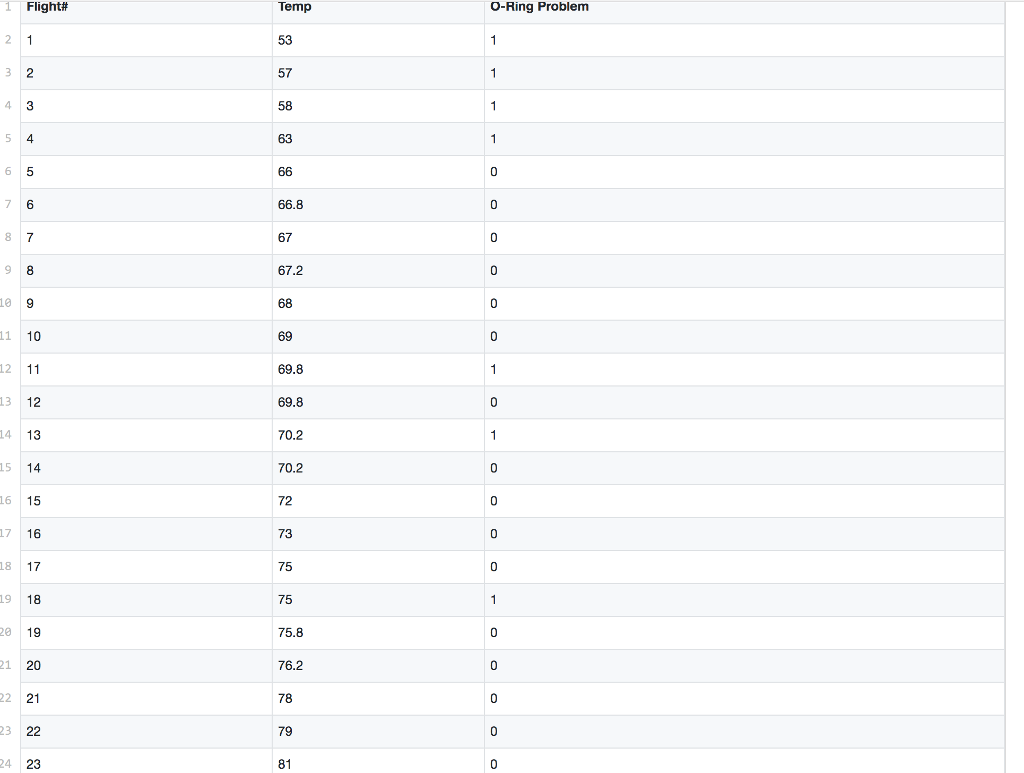
Use the Temperature and failure data from the Challenger O-rings in lecture_18 (challenger_oring.csv). Your independent variable is temerature and your dependent variable is failure (1 = fail, 0 = pass). Create a function called cost_logistic.m that takes the vector a, and independent variable x and dependent variable y. Use the function, sigma(t) = 1/1+e^-t where t = a_0 + a_1x. Use the cost function. J(a_0, a_1) 1/m sigma^n_i=1 [-y_i log (sigma(t_i)) - (1 - y_i) log((1 - sigma(t_i)))] and gradient partial J/partial a_i = 1/m sigma^N_k=1 (sigma(t_k) - y_k) x^i_k where $x_{k}^{i} is the k-th value of temperature raised to the i-th power (0, and 1) a. edit cost_logistic.m so that the output is [J, grad] or [cost, gradient] b. use the following code to solve for a0 and al % Set options for fminunc options = optimset ('GradObj', 'On', 'MaxIter' 400); % Run fminunc to obtain the optima theta % This function will return theta and the cost [theta cost] =... fminunc(@ (a) (costFunction(a, x, y)), initial_a options)
Step by Step Solution
There are 3 Steps involved in it

Get step-by-step solutions from verified subject matter experts