

Question: Using matlab code format as follows clc %clear command clear % clear workspace disp ('Solution for Problem 1') %---input Data--- DOF = 9; %9 nodes
Using matlab code format as follows
| clc %clear command clear % clear workspace
disp ('Solution for Problem 1')
%---input Data--- DOF = 9; %9 nodes one degree of freedom elementnodes = [1 2; 2 3; 3 4; 4 5; 5 6; 6 7; 7 8; 8 9]; elementnumber = size(elementnodes,1); k = [200;200;200;200;400;400;400;400]; K=zeros(DOF); F=zeros(DOF,1);
%---Global Stiffness--- for e=1:elementnumber elementdof = elementnodes(e,:); K(elementdof,elementdof)=K(elementdof,elementdof)+k(e)*[1 -1;-1 1]; end
%---Boundary Conditions--- Kred=K; %red = reduced prescribeddof = [1;9]; %we know displacement at these points (two boundary conditions) numberBC = size(prescribeddof,1); for bc=1:numberBC bcvector = zeros(1,DOF); bcvector(prescribeddof(bc))=1; Kred(prescribeddof(bc),:)=bcvector; end
%---loads--- F(5,1) = 1500;
%---Solution--- disp('Global Displacement Vector') D=KredF; ii=1:DOF; [ii' D]
%---Results--- disp('Global Force Vector') F=K*D; ii=1:DOF; [ii' F] %Reaction Force vector disp('Reaction Force Vector is;') [prescribeddof F(prescribeddof)]
%forces for Each Element for e=1:elementnumber elementdof=elementnodes(e,:); d=D(elementdof); disp(['Forces in Element ',num2str(e),' are:']) f = k(e)*[1 -1;-1 1]*d end
|
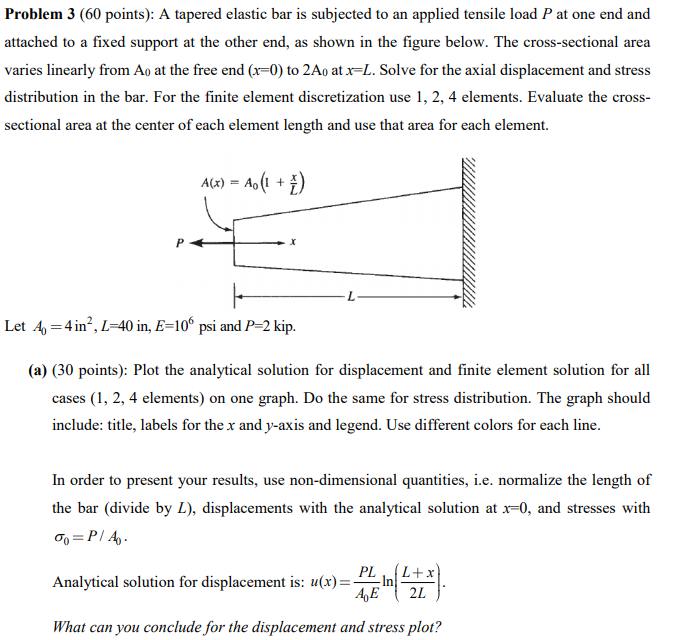
Problem 3 (60 points): A tapered elastic bar is subjected to an applied tensile load P at one end and attached to a fixed support at the other end, as shown in the figure below. The cross-sectional area varies linearly from Ao at the free end (r-0) to 2Ao at r-L. Solve for the axial displacement and stress distribution in the bar. For the finite element discretization use 1, 2, 4 elements. Evaluate the cross- sectional area at the center of each element length and use that area for each element A(x) = Ao (1 + Let =4in, L-40 in, E-106 psi and P-2 kip. (a) (30 points): Plot the analytical solution for displacement and finite element solution for all cases (1, 2, 4 elements) on one graph. Do the same for stress distribution. The graph should include: title, labels for the x and y-axis and legend. Use different colors for each line. In order to present your results, use non-dimensional quantities, i.e. normalize the length of the bar (divide by L), displacements with the analytical solution at x-0, and stresses with Analytical solution for displacement is: ux-In What can you conclude for the displacement and stress plot? Problem 3 (60 points): A tapered elastic bar is subjected to an applied tensile load P at one end and attached to a fixed support at the other end, as shown in the figure below. The cross-sectional area varies linearly from Ao at the free end (r-0) to 2Ao at r-L. Solve for the axial displacement and stress distribution in the bar. For the finite element discretization use 1, 2, 4 elements. Evaluate the cross- sectional area at the center of each element length and use that area for each element A(x) = Ao (1 + Let =4in, L-40 in, E-106 psi and P-2 kip. (a) (30 points): Plot the analytical solution for displacement and finite element solution for all cases (1, 2, 4 elements) on one graph. Do the same for stress distribution. The graph should include: title, labels for the x and y-axis and legend. Use different colors for each line. In order to present your results, use non-dimensional quantities, i.e. normalize the length of the bar (divide by L), displacements with the analytical solution at x-0, and stresses with Analytical solution for displacement is: ux-In What can you conclude for the displacement and stress plot
Step by Step Solution
There are 3 Steps involved in it

Get step-by-step solutions from verified subject matter experts