

Question: USING MATLAB CODE TO SOLVE THIS We showed an instrumented version that computed the number of recursive function calls using a persistent variable. Another way
USING MATLAB CODE TO SOLVE THIS
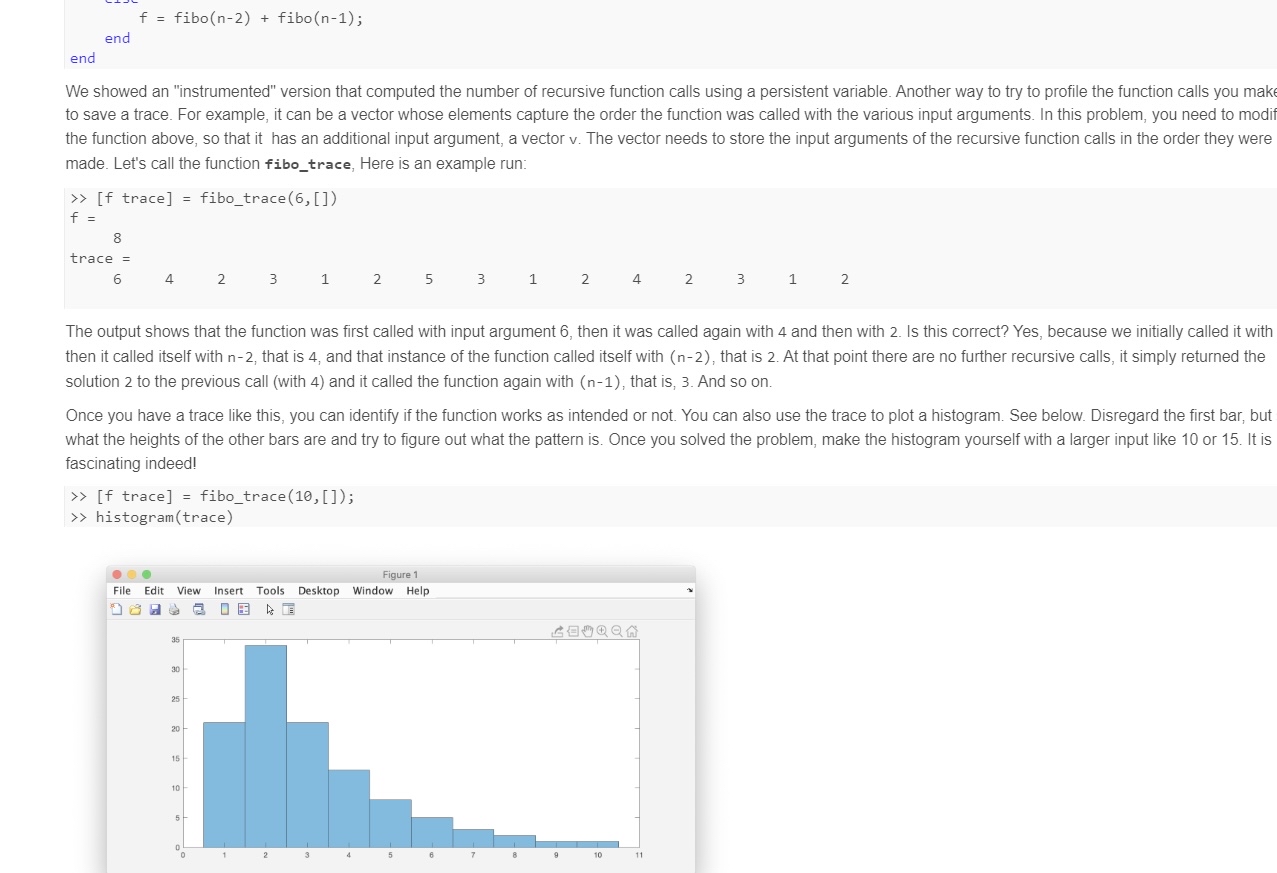
We showed an "instrumented" version that computed the number of recursive function calls using a persistent variable. Another way to try to profile the function calls you make is to save a trace. For example, it can be a vector whose elements capture the order the function was called with the various input arguments. In this problem, you need to modify the function above, so that it has an additional input argument, a vector v The vector needs to store the input arguments of the recursive function calls in the order they were made. Let's call the function fibotrace, Here is an example run:
fibofibo;
end
end
We showed an "instrumented" version that computed the number of recursive function calls using a persistent variable. Another way to try to profile the function calls you make to save a trace. For example, it can be a vector whose elements capture the order the function was called with the various input arguments. In this problem, you need to modif the function above, so that it has an additional input argument, a vector The vector needs to store the input arguments of the recursive function calls in the order they were made. Let's call the function fibotrace, Here is an example run:The output shows that the function was first called with input argument then it was called again with and then with Is this correct? Yes, because we initially called it with then it called itself with n that is and that instance of the function called itself with n that is At that point there are no further recursive calls, it simply returned the solution to the previous call with and it called the function again with n that is And so onOnce you have a trace like this, you can identify if the function works as intended or not. You can also use the trace to plot a histogram. See below. Disregard the first bar, but what the heights of the other bars are and try to figure out what the pattern is Once you solved the problem, make the histogram yourself with a larger input like or It is fascinating indeed!
trace race ;
histogram
Step by Step Solution
There are 3 Steps involved in it
1 Expert Approved Answer
Step: 1 Unlock

Question Has Been Solved by an Expert!
Get step-by-step solutions from verified subject matter experts
Step: 2 Unlock
Step: 3 Unlock