

Question: Using Matlab: Comorbidity count 0 1 2 3 332 360 324 270 418 385 299 211 Phy 4 Phy 28 4 144 111 5 40
Using Matlab: 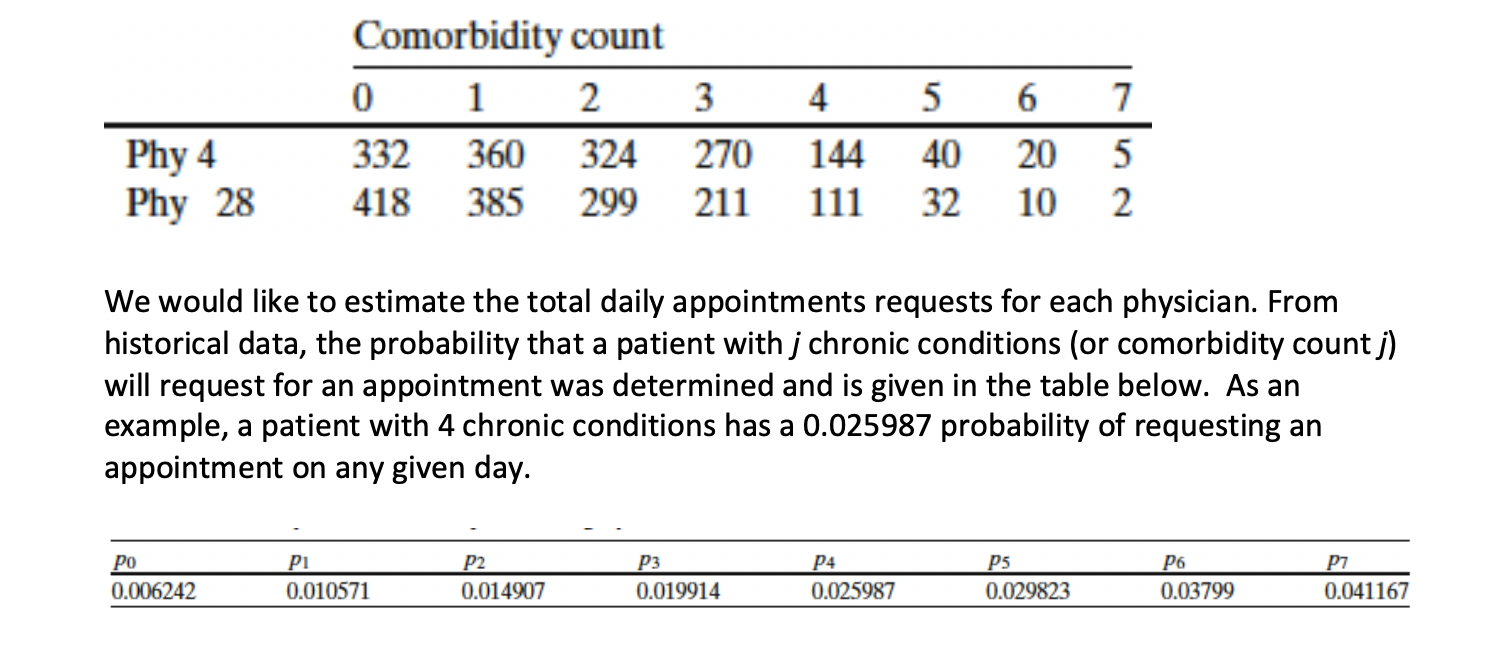
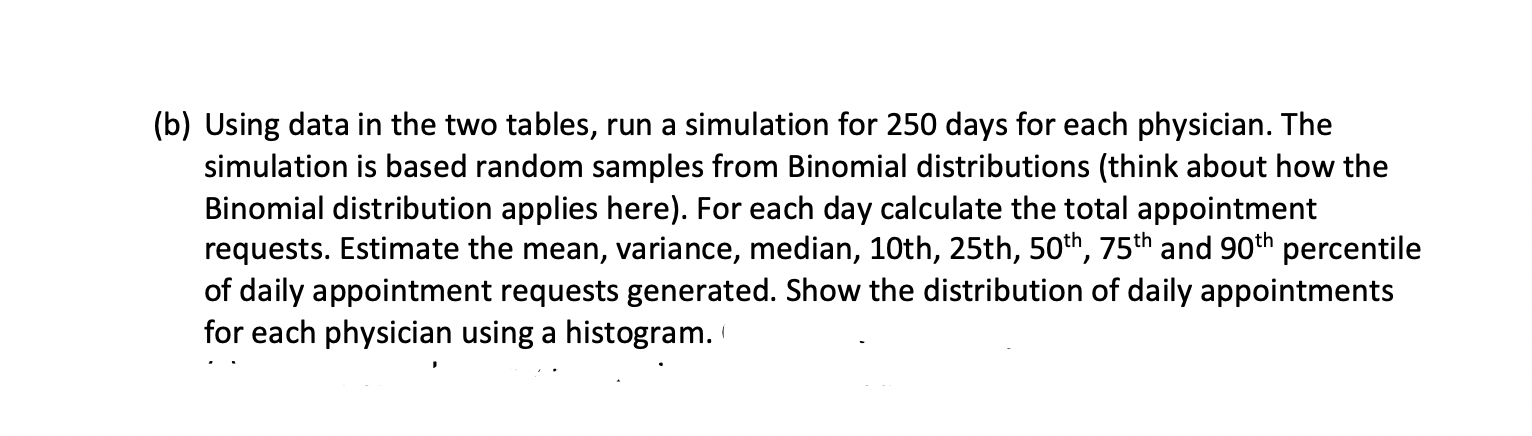
Comorbidity count 0 1 2 3 332 360 324 270 418 385 299 211 Phy 4 Phy 28 4 144 111 5 40 32 6 20 10 7 5 2 We would like to estimate the total daily appointments requests for each physician. From historical data, the probability that a patient with j chronic conditions (or comorbidity countj) will request for an appointment was determined and is given in the table below. As an example, a patient with 4 chronic conditions has a 0.025987 probability of requesting an appointment on any given day. P5 Po 0.006242 Pi 0.010571 P2 0.014907 P4 0.025987 P6 0.03799 P7 0.041167 0.019914 0.029823 (b) Using data in the two tables, run a simulation for 250 days for each physician. The simulation is based random samples from Binomial distributions (think about how the Binomial distribution applies here). For each day calculate the total appointment requests. Estimate the mean, variance, median, 10th, 25th, 50th, 75th and 90th percentile of daily appointment requests generated. Show the distribution of daily appointments for each physician using a histogram. Comorbidity count 0 1 2 3 332 360 324 270 418 385 299 211 Phy 4 Phy 28 4 144 111 5 40 32 6 20 10 7 5 2 We would like to estimate the total daily appointments requests for each physician. From historical data, the probability that a patient with j chronic conditions (or comorbidity countj) will request for an appointment was determined and is given in the table below. As an example, a patient with 4 chronic conditions has a 0.025987 probability of requesting an appointment on any given day. P5 Po 0.006242 Pi 0.010571 P2 0.014907 P4 0.025987 P6 0.03799 P7 0.041167 0.019914 0.029823 (b) Using data in the two tables, run a simulation for 250 days for each physician. The simulation is based random samples from Binomial distributions (think about how the Binomial distribution applies here). For each day calculate the total appointment requests. Estimate the mean, variance, median, 10th, 25th, 50th, 75th and 90th percentile of daily appointment requests generated. Show the distribution of daily appointments for each physician using a histogram
Step by Step Solution
There are 3 Steps involved in it

Get step-by-step solutions from verified subject matter experts