

Question: using matlab Consider the following functions y and z: y = sin(5t) e z = cos(5t) e = Where, t is a vector of 1000
using matlab
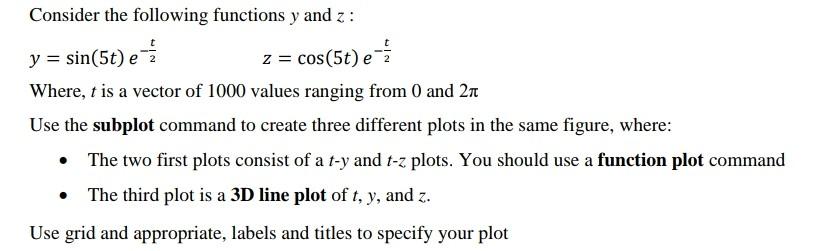
Consider the following functions y and z: y = sin(5t) e z = cos(5t) e = Where, t is a vector of 1000 values ranging from 0 and 2n Use the subplot command to create three different plots in the same figure, where: The two first plots consist of a t-y and t-z plots. You should use a function plot command The third plot is a 3D line plot of t, y, and z. Use grid and appropriate, labels and titles to specify your plot
Step by Step Solution
There are 3 Steps involved in it
1 Expert Approved Answer
Step: 1 Unlock

Question Has Been Solved by an Expert!
Get step-by-step solutions from verified subject matter experts
Step: 2 Unlock
Step: 3 Unlock