

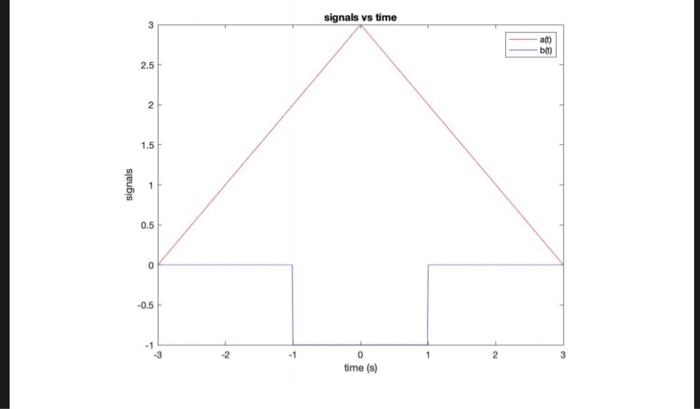
Question: USING MATLAB, Create the graph below with a(t) and b(t). Then, you will need to create 2 new points, c(t) and d(t). c(t) will be
USING MATLAB,
Create the graph below with a(t) and b(t).
Then, you will need to create 2 new points, c(t) and d(t).
c(t) will be the color red and will be a(t), but shifted to the left 3 units and compressed by 2.
d(t) will be the color blue and will be b(t), but shifted to the left by 1 unit and raised vertically by 3 units.
All points a(t), b(t), c(t), and d(t) should be plotted on the same graph and included in the legend. a(t) and c(t) are red. b(t) and d(t) are blue.
Show code and the final graph please. 
For all the questions below, use a time resolution of 10ms for your time axis:t1-3:0.01:31 You need to submit only one script that addresses answers for all three questions below with three different figures. Remember your script should be self-sufficient and run without any errors to receive any points signals vs time 2.5 1.5 0.5 0.5 -1 -3 -2 ime (s)
Step by Step Solution
There are 3 Steps involved in it
1 Expert Approved Answer
Step: 1 Unlock

Question Has Been Solved by an Expert!
Get step-by-step solutions from verified subject matter experts
Step: 2 Unlock
Step: 3 Unlock