

Question: Using MATLAB do a linear regression analysis. The values of x and their corresponding values of y are shown in the table below. Use MATLAB
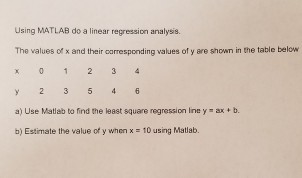
Using MATLAB do a linear regression analysis. The values of x and their corresponding values of y are shown in the table below. Use MATLAB to find the least square regression line y = ax + b. b) Estimate the value of y when x = 10 using MATLAB
Step by Step Solution
There are 3 Steps involved in it
1 Expert Approved Answer
Step: 1 Unlock

Question Has Been Solved by an Expert!
Get step-by-step solutions from verified subject matter experts
Step: 2 Unlock
Step: 3 Unlock