

Question: Using Matlab******** Download the data file Class_09_Homework mat from eCampus. Plot a histogram (Figure 1) in MATLAB to determine if the data is normally distributed.
Using Matlab********
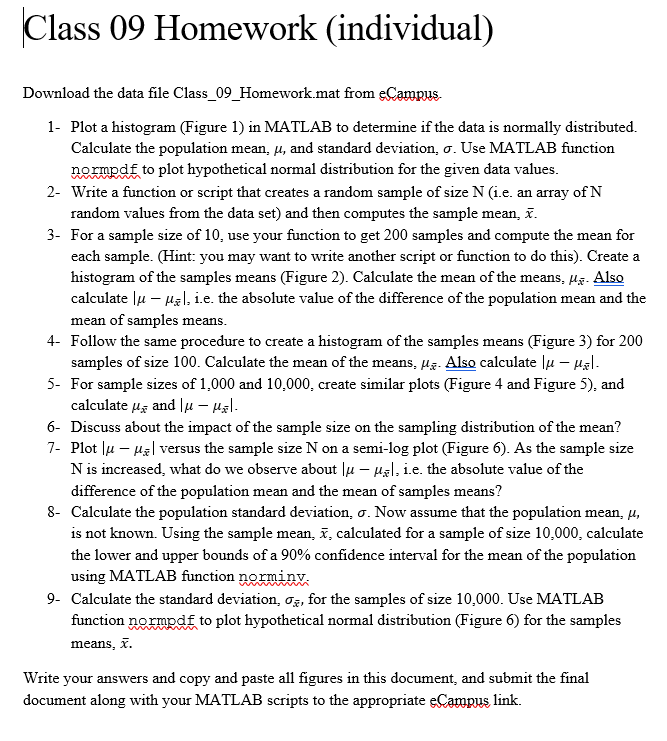
Download the data file Class_09_Homework mat from eCampus. Plot a histogram (Figure 1) in MATLAB to determine if the data is normally distributed. Calculate the population mean, mu, and standard deviation, sigma. Use MATLAB function normpdf to plot hypothetical normal distribution for the given data values. Write a function or script that creates a random sample of size N (i.e. an array of N random values from the data set) and then computes the sample mean, x bar. For a sample size of 10, use your function to get 200 samples and compute the mean for each sample. Create a histogram of the samples m (Figure 2). Calculate the mean of the means. Mu_x bar. Also calculate |mu - mu_x bar|, i.e. the absolute value of the difference of the population mean and the mean of samples means. Follow the same procedure to create a histogram of the samples means (Figure 3) for 200 samples of size 100. Calculate the mean of the means, mu_x bar. Also calculate |mu - mu_x bar|. For sample sizes of 1,000 and 10,000, create similar plots (Figure 4 and Figure 5), and calculate mu_x bar and |mu - mu_x bar|. Discuss about the impact of the sample size on the sampling distribution of the mean? Plot |mu - mu_x bar| versus the sample size N on a semi-log plot (Figure 6). As the sample size N is increased, what do we observe about |mu - mu_x bar|, i.e. the absolute value of the difference of the population mean and the mean of samples means? Calculate the population standard deviation, sigma. Now assume that the population mean, mu, is not known. Using the sample mean, x bar, calculated for a sample of size 10,000, calculate the lower and upper bounds of a 90% confidence interval for the mean of the population using MATLAB function norminv. Calculate the standard deviation, sigma_x bar, for the samples of size 10,000. Use MATLAB function normpdf to plot hypothetical normal distribution (Figure 6) for the samples means, x bar. Write your answers and copy and paste all figures in this document, and submit the final document along with your MATLAB scripts to the appropriate eCampus link
Step by Step Solution
There are 3 Steps involved in it

Get step-by-step solutions from verified subject matter experts