

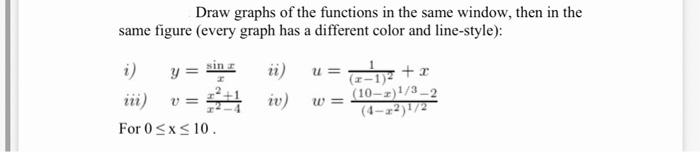
Question: using Matlab Draw graphs of the functions in the same window, then in the same figure (every graph has a different color and line-style): y
using Matlab
Draw graphs of the functions in the same window, then in the same figure (every graph has a different color and line-style): y = sin u= + (x-1) (10-2) 1/3-2 12+1 V = iv) For 0
Step by Step Solution
There are 3 Steps involved in it
1 Expert Approved Answer
Step: 1 Unlock

Question Has Been Solved by an Expert!
Get step-by-step solutions from verified subject matter experts
Step: 2 Unlock
Step: 3 Unlock