

Question: Using MATLAB On figure window 1, plot the following functions on 2 separate subplots for values of t from 0 to 10 in steps of
 Using MATLAB
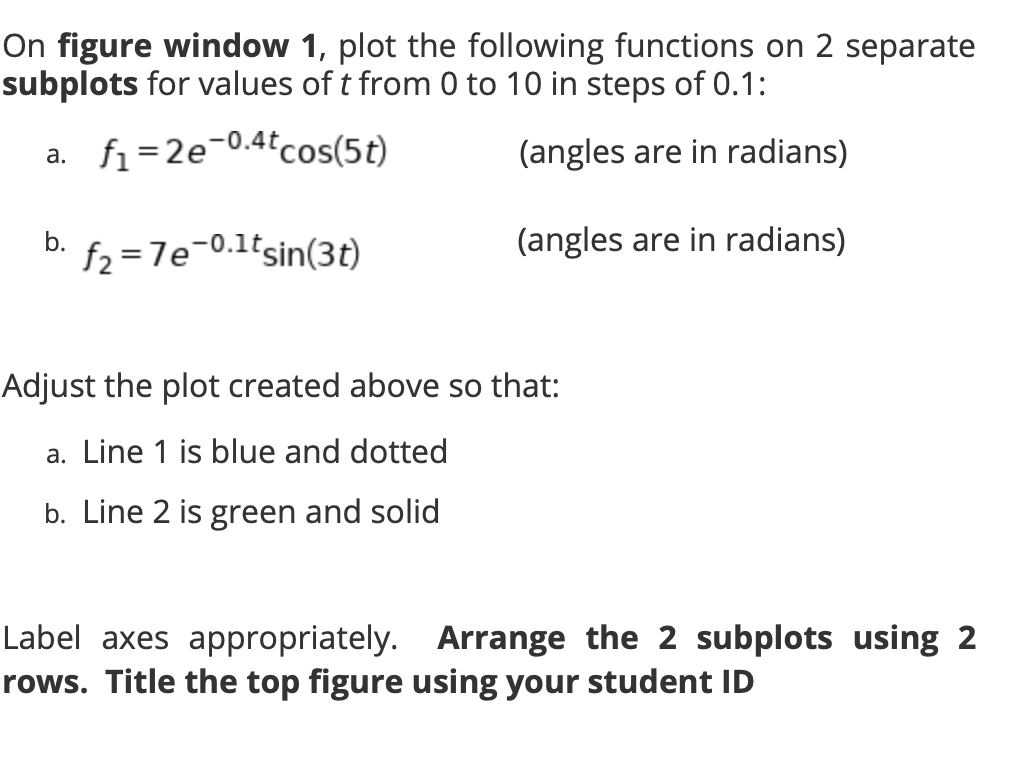
On figure window 1, plot the following functions on 2 separate subplots for values of t from 0 to 10 in steps of 0.1: a. fi=2e-0.4tcos(5t) (angles are in radians) . b. f2=7e-0.1tsin(3t) (angles are in radians) Adjust the plot created above so that: a. Line 1 is blue and dotted b. Line 2 is green and solid Label axes appropriately. Arrange the 2 subplots using 2 rows. Title the top figure using your student ID
Step by Step Solution
There are 3 Steps involved in it
1 Expert Approved Answer
Step: 1 Unlock

Question Has Been Solved by an Expert!
Get step-by-step solutions from verified subject matter experts
Step: 2 Unlock
Step: 3 Unlock