

Question: using matlab please Create a Python or Matlab m-file script to read the data of example 2.3 (page 21) from an excel spreadsheet and calculate
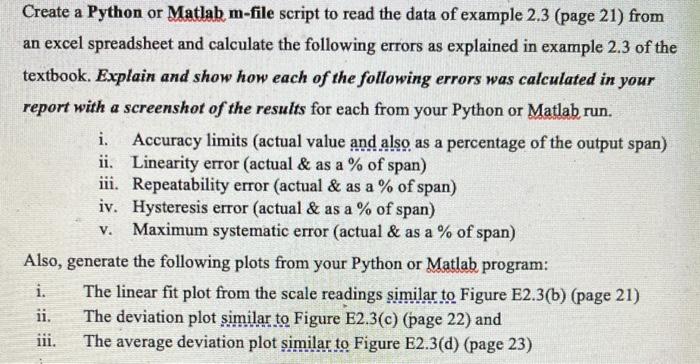
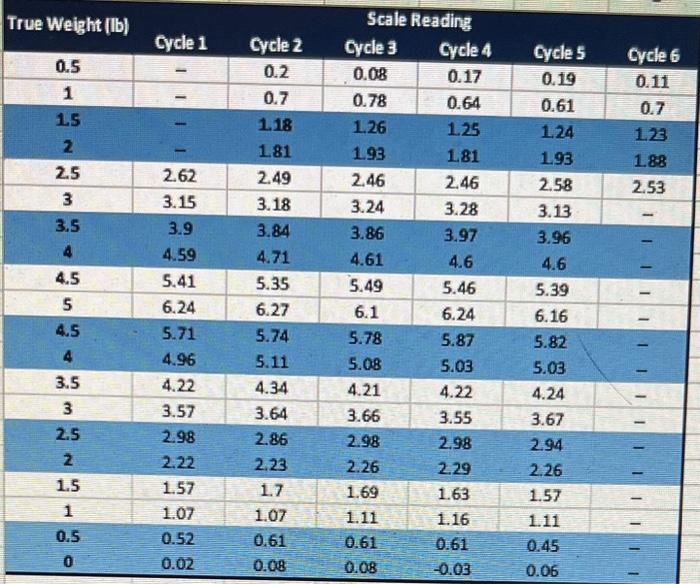
Create a Python or Matlab m-file script to read the data of example 2.3 (page 21) from an excel spreadsheet and calculate the following errors as explained in example 2.3 of the textbook. Explain and show how each of the following errors was calculated in your report with a screenshot of the results for each from your Python or Matlab run. i. Accuracy limits (actual value and also as a percentage of the output span) ii. Linearity error (actual \& as a \% of span) iii. Repeatability error (actual \& as a % of span) iv. Hysteresis error (actual \& as a \% of span) v. Maximum systematic error (actual \& as a % of span) Also, generate the following plots from your Python or Matlab program: i. The linear fit plot from the scale readings similar to Figure E2.3(b) (page 21) ii. The deviation plot similar to Figure E2.3(c) (page 22) and iii. The average deviation plot similar to Figure E2.3(d) (page 23)
Step by Step Solution
There are 3 Steps involved in it

Get step-by-step solutions from verified subject matter experts