

Question: USING MATLAB PLEASE HELP WITH PART B ONLY, ONLY PART B. AND SEE IF I NEED TO FIX ANYTHING ON PART A I have part
USING MATLAB PLEASE HELP WITH PART B ONLY, ONLY PART B. AND SEE IF I NEED TO FIX ANYTHING ON PART A
I have part A here
A)
r=[0.01 0.05 0.1 0.2 0.4 0.5];
h=[14 3 1.5 0.8 .4 0.2];
t=0:0.005:.6;
for i=2:7
[p,x]=polyfit(r,h,i);
f=polyval(p,t);
subplot(3,2,i-1)
plot(r,h,'*',t,f,'-');
legend('exp','polyfit');
axis([0 0.6 -8 15]);
title(['order is : ',num2str(i)]);
end
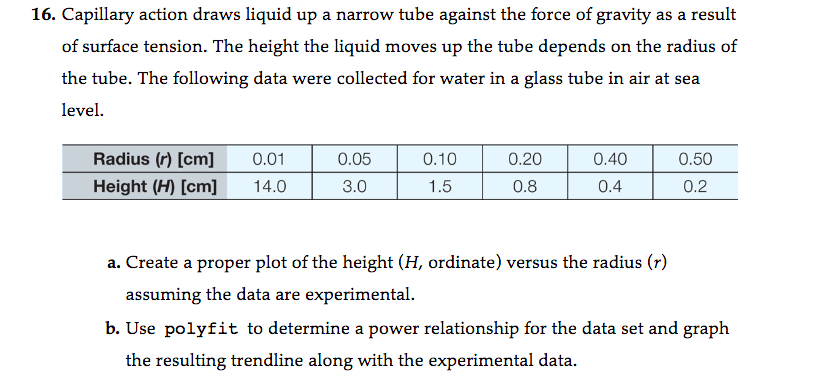
16. Capillary action draws liquid up a narrow tube against the force of gravity as a result of surface tension. The height the liquid moves up the tube depends on the radius of the tube. The following data were collected for water in a glass tube in air at sea level. Radius (r) [cm] 0.01 Height (H [cm] 14.0 0.20 0.8 0.05 0.10 0.40 0.50 3.0 1.5 0.4 0.2 a. Create a proper plot of the height (H, ordinate) versus the radius (r) assuming the data are experimental b. Use polyfit to determine a power relationship for the data set and graph the resulting trendline along with the experimental data
Step by Step Solution
There are 3 Steps involved in it

Get step-by-step solutions from verified subject matter experts