

Question: USING MATLAB. Please show codes and graph screenshot 8(0) ho -1 1 -1 2. Write another m-file MATLAB script [i.e., a modification of the script
USING MATLAB. Please show codes and graph screenshot
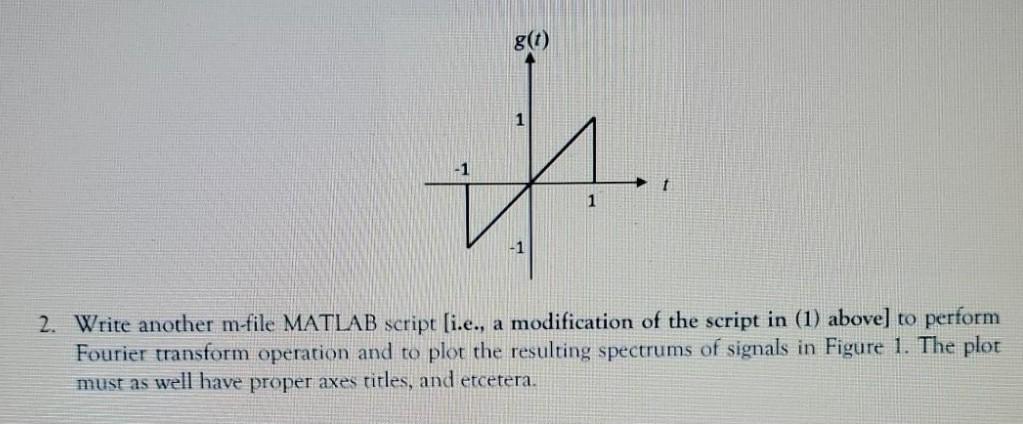
8(0) ho -1 1 -1 2. Write another m-file MATLAB script [i.e., a modification of the script in (1) above) to perform Fourier transform operation and to plot the resulting spectrums of signals in Figure 1. The plot must as well have proper axes titles, and etcetera
Step by Step Solution
There are 3 Steps involved in it
1 Expert Approved Answer
Step: 1 Unlock

Question Has Been Solved by an Expert!
Get step-by-step solutions from verified subject matter experts
Step: 2 Unlock
Step: 3 Unlock