

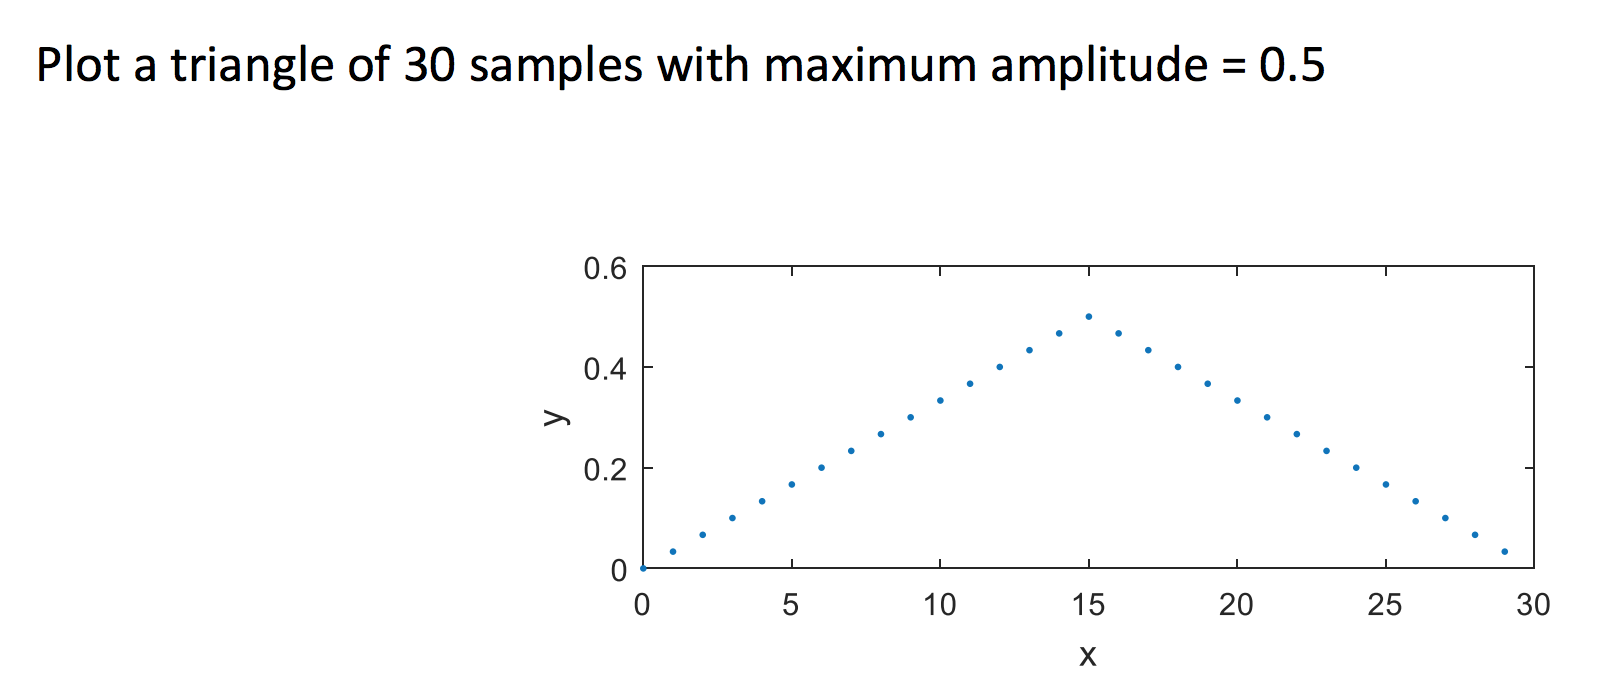
Question: using matlab Plot a triangle of 30 samples with maximum amplitude = 0.5 OL.............. 0 5 10 15 20 25 30
using matlab
Plot a triangle of 30 samples with maximum amplitude = 0.5 OL.............. 0 5 10 15 20 25 30
Step by Step Solution
There are 3 Steps involved in it
1 Expert Approved Answer
Step: 1 Unlock

Question Has Been Solved by an Expert!
Get step-by-step solutions from verified subject matter experts
Step: 2 Unlock
Step: 3 Unlock