

Question: USING MATLAB, plot the 2D temperature distribution in the blade, around the channel for nodes 1 to 21. Here is the data that needs to
USING MATLAB, plot the 2D temperature distribution in the blade, around the channel for nodes 1 to 21. Here is the data that needs to be graphed:
I just need this to be plotted in the style of a 2d distribution using imagesc.
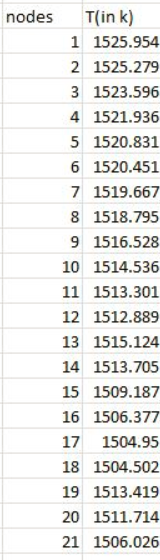
nodes T(in k) 1 1525.954 2 1525.279 3 1523.596 4 1521.936 5 1520.831 6 1520.451 7 1519.667 8 1518.795 9 1516.528 10 1514.536 11 1513.301 12 1512.889 13 1515.124 14 1513.705 15 1509.187 16 1506.377 17 1504.95 18 1504.502 19 1513.419 20 1511.714 21 1506.026 nodes T(in k) 1 1525.954 2 1525.279 3 1523.596 4 1521.936 5 1520.831 6 1520.451 7 1519.667 8 1518.795 9 1516.528 10 1514.536 11 1513.301 12 1512.889 13 1515.124 14 1513.705 15 1509.187 16 1506.377 17 1504.95 18 1504.502 19 1513.419 20 1511.714 21 1506.026
Step by Step Solution
There are 3 Steps involved in it

Get step-by-step solutions from verified subject matter experts