

Question: Using MATLAB signals and systems textbook: computer explorations in signals and systems using matlab 13.8 First-Order Recursive Discrete-Time Filters This exercise demonstrates the effect of
Using MATLAB signals and systems
textbook: computer explorations in signals and systems using matlab
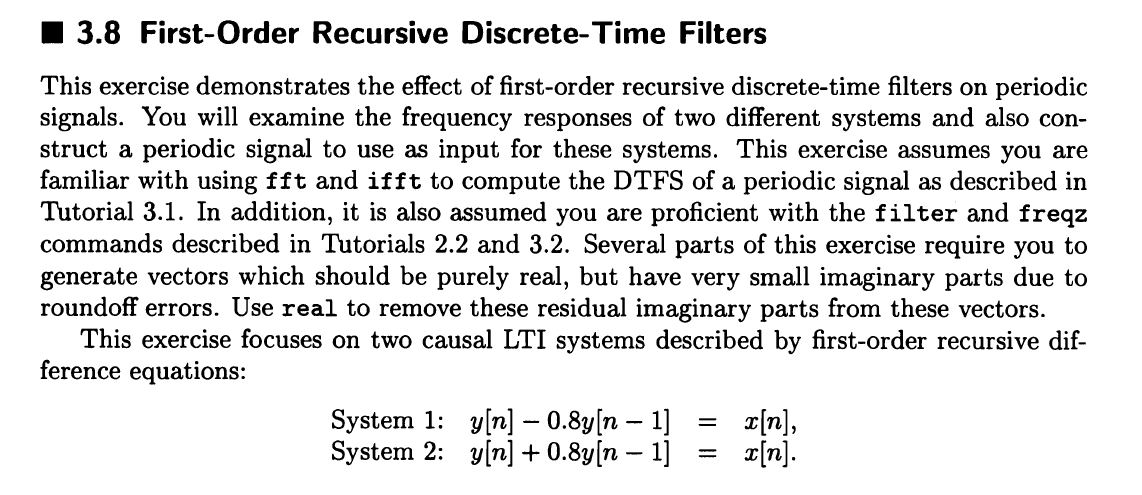
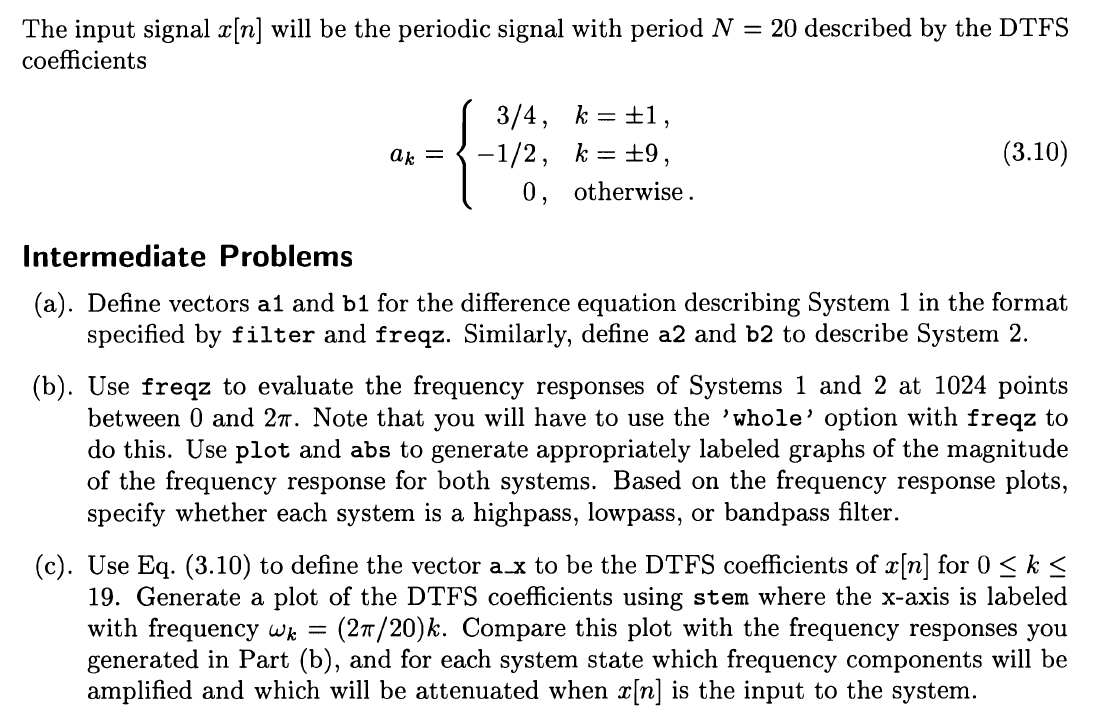
13.8 First-Order Recursive Discrete-Time Filters This exercise demonstrates the effect of first-order recursive discrete-time filters on periodic signals. You will examine the frequency responses of two different systems and also con- struct a periodic signal to use as input for these systems. This exercise assumes you are familiar with using fft and ifft to compute the DTFS of a periodic signal as described in Tutorial 3.1. In addition, it is also assumed you are proficient with the filter and freqz commands described in Tutorials 2.2 and 3.2. Several parts of this exercise require you to generate vectors which should be purely real, but have very small imaginary parts due to roundoff errors. Use real to remove these residual imaginary parts from these vectors. This exercise focuses on two causal LTI systems described by first-order recursive dif- ference equations: System 1: y[n] 0.8y[n 1] x[n], System 2: y[n] + 0.8y[n 1] x[n]. The input signal x[n] will be the periodic signal with period N = 20 described by the DTFS coefficients ak = 3/4, k = +1, -1/2, k = 9, 0, otherwise. (3.10) Intermediate Problems (a). Define vectors al and b1 for the difference equation describing System 1 in the format specified by filter and freqz. Similarly, define a2 and b2 to describe System 2. (b). Use freqz to evaluate the frequency responses of Systems 1 and 2 at 1024 points between 0 and 27. Note that you will have to use the "whole' option with freqz to do this. Use plot and abs to generate appropriately labeled graphs of the magnitude of the frequency response for both systems. Based on the frequency response plots, specify whether each system is a highpass, lowpass, or bandpass filter. (c). Use Eq. (3.10) to define the vector a.x to be the DTFS coefficients of x[n] for 0
Step by Step Solution
There are 3 Steps involved in it

Get step-by-step solutions from verified subject matter experts