

Question: Using Matlab, solve 3. b) powerdata.dat http://tinyurl.com/hgmkvfs The power output from a local power plant is measured in unit of megawatts over a period of
Using Matlab, solve 3. b)
powerdata.dat http://tinyurl.com/hgmkvfs
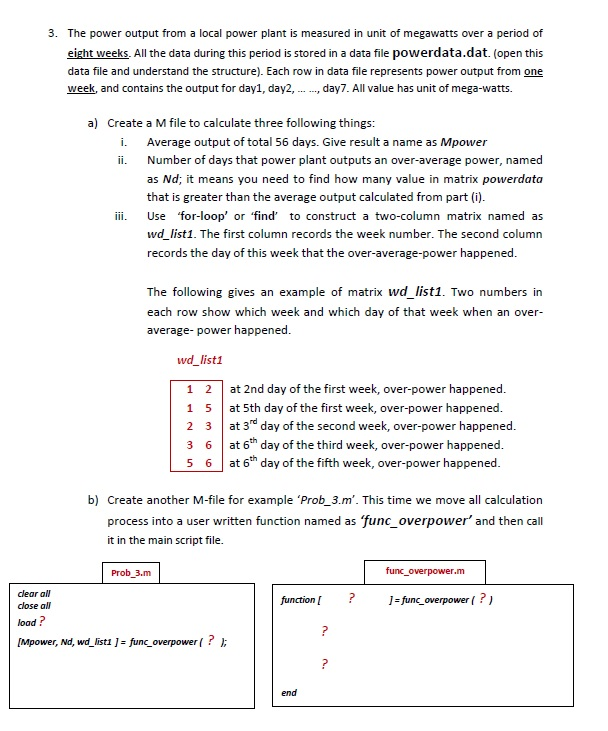
The power output from a local power plant is measured in unit of megawatts over a period of eight weeks. All the data during this period is stored in a data file powerdata.dat. (open this data file and understand the structure). Each row in data file represents power output from one week, and contains the output for dayl, day2, day7. All value has unit of mega-watts. Create a M file to calculate three following things: Average output of total 56 days. Give result a name as Mpower Number of days that power plant outputs an over-average power, named as Nd; it means you need to find how many value in matrix powerdata that is greater than the average output calculated from part (i). Use 'for-loop' or 'find' to construct a two-column matrix named as wd_listl. The first column records the week number. The second column records the day of this week that the over-average-power happened. The following gives an example of matrix wd_listl. Two numbers in each row show which week and which day of that week when an over-average- power happened. The power output from a local power plant is measured in unit of megawatts over a period of eight weeks. All the data during this period is stored in a data file powerdata.dat. (open this data file and understand the structure). Each row in data file represents power output from one week, and contains the output for dayl, day2, day7. All value has unit of mega-watts. Create a M file to calculate three following things: Average output of total 56 days. Give result a name as Mpower Number of days that power plant outputs an over-average power, named as Nd; it means you need to find how many value in matrix powerdata that is greater than the average output calculated from part (i). Use 'for-loop' or 'find' to construct a two-column matrix named as wd_listl. The first column records the week number. The second column records the day of this week that the over-average-power happened. The following gives an example of matrix wd_listl. Two numbers in each row show which week and which day of that week when an over-average- power happened
Step by Step Solution
There are 3 Steps involved in it

Get step-by-step solutions from verified subject matter experts