

Question: using matlab (specifically nested loops), write a variety of programs that solves for the following data. (a) mean for each year for the eight year
using matlab (specifically nested loops), write a variety of programs that solves for the following data.
(a) mean for each year for the eight year period.
(b) determine how many months each year exceed the overall average for the eight-year period.
(c) create a report that lists the month(number) and the year for the each of the months that exceed the overall average.
(d) determine the average for each month for the eight-year period.
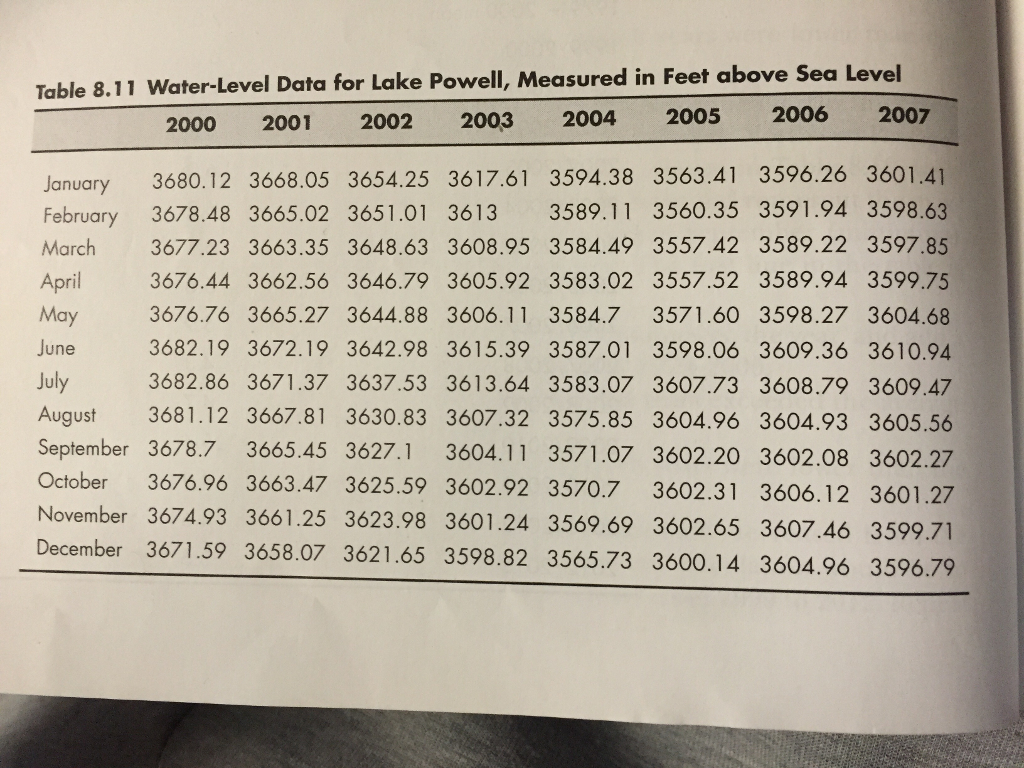
Table 8.11 Level Data for Lake Powell, Measured in Feet above Sea Level 2000 2001 2002 2003 2004 2005 2006 2007 January 3680.12 3668.05 3654.25 3617.61 3594.38 3563.4 359 6.26 360 February 3678.48 3665.02 3651.01 3613 3589.11 3560.35 3591.94 3598.63 March 3677.23 3663.35 3648.63 3608.95 358 4.49 355 7.4 35 89.22 3597.85 April 3676.44 3662.56 3646.79 3605.92 3583.02 355 52 3589.94 3599.75 May 3676.76 3665.27 3644.88 3606. 1 1 3584.7 3571.60 3598.27 3604.68 June 3682.19 3672.19 3642.98 3615.39 3587.0 3598.06 3609.36 36 10.9 July 3682.86 3671.37 3637.53 3613.64 3583.07 360 7.7 3608. 79 3609 47 August 3681.12 3667.81 3630.83 3607.32 3575.85 360 96 3604.93 3605.56 September 3678.7 3665.45 3627.1 3604.11 357 1.07 360 2.20 360 2.08 360 2.27 october 3676.96 3663.47 3625.59 3602.92 3570.7 3602.3 1 3606 12 3601.27 November 3674.93 3661.25 3623.98 3601.24 3569.69 360 2.65 3607. 46 3599. December 3671.59 3658.07 3621.65 3598.82 3565.73 360 14 3604.96 3596.79
Step by Step Solution
There are 3 Steps involved in it

Get step-by-step solutions from verified subject matter experts