

Question: Using MATLAB suppose you want to plot a quadratic function y = ar +br-c with the user specifying the coefficients. Suppose also that you want
Using MATLAB
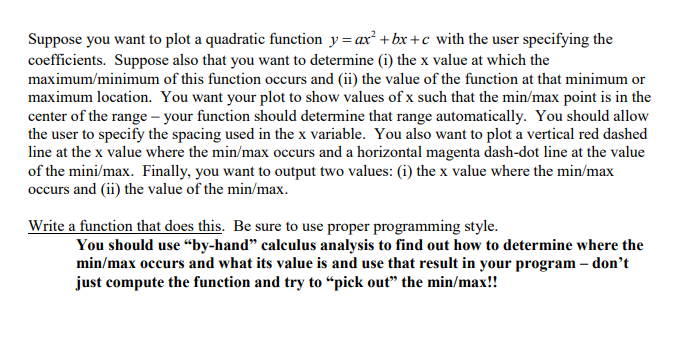
suppose you want to plot a quadratic function y = ar +br-c with the user specifying the coefficients. Suppose also that you want to determine (i) the x value at which the maximum/minimum of this function occurs and (ii) the value of the function at that minimum or maximum location. You want your plot to show values of x such that the min/max point is in the center of the range - your function should determine that range automatically. You should allow the user to specify the spacing used in the x variable. You also want to plot a vertical red dashed line at the x value where the min/max occurs and a horizontal magenta dash-dot line at the value of the mini/max. Finally, you want to output two values:(i) the x value where the min/max occurs and (ii) the value of the min/max Write a function that does this, Be sure to use proper programming style You should use by-hand" calculus analysis to find out how to determine where the min/max occurs and what its value is and use that result in your program -don't just compute the function and try to pick out" the min/max
Step by Step Solution
There are 3 Steps involved in it

Get step-by-step solutions from verified subject matter experts