

Question: Using Matlab type the answer (3 marks) Q15. Create x and y vectors to represent the following data: 10 23 20 45 30 60 40
Using Matlab type the answer 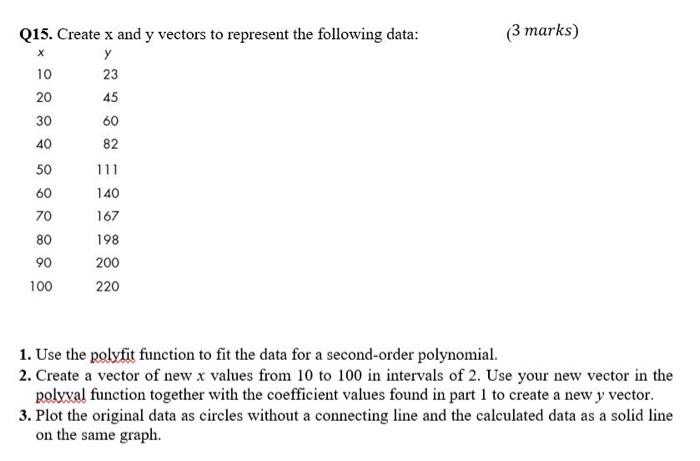
(3 marks) Q15. Create x and y vectors to represent the following data: 10 23 20 45 30 60 40 82 50 60 70 80 90 100 140 167 198 200 220 1. Use the polyfit function to fit the data for a second-order polynomial. 2. Create a vector of new x values from 10 to 100 in intervals of 2. Use your new vector in the polyval function together with the coefficient values found in part 1 to create a new y vector. 3. Plot the original data as circles without a connecting line and the calculated data as a solid line on the same graph
Step by Step Solution
There are 3 Steps involved in it
1 Expert Approved Answer
Step: 1 Unlock

Question Has Been Solved by an Expert!
Get step-by-step solutions from verified subject matter experts
Step: 2 Unlock
Step: 3 Unlock