

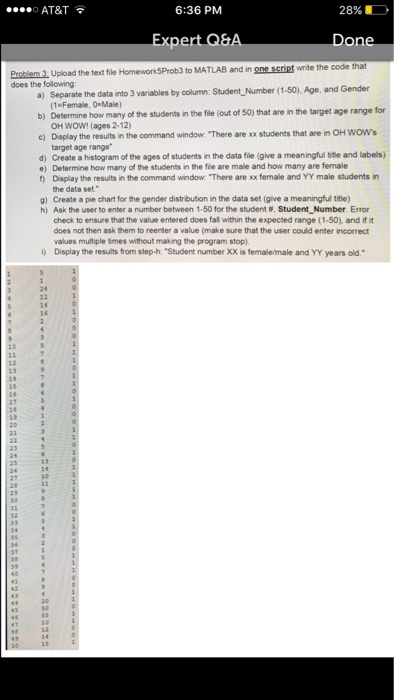
Question: using Matlab Upload the text file Homework5Prob3 to MATLAB and in one script write the code that does the following: a) Separate the data into
 using Matlab
 Upload the text file Homework5Prob3 to MATLAB and in one script write the code that does the following: a) Separate the data into 3 variables by column: Student_ Number (1-50), Age, and Gender (1 = Female, 0 = Male) b) Determine how many of the students in the file (out of 50) that are in the target age range for OH WOW! (ages 2-12) c) display the results in the command window: "There are xx students that are in OH OW's target age range" d) Create a histogram of the ages of students in the data fie (give a meaningful title and labels) e) Determine how many of the students in the fie are male and how many are female f) Display the results in the command window. "There are xx female and YY male students in the data set." g) Create a pie chart for the gender distribution in the data set (give a meaningful title) h) Ask the user to enter a number between 1-50 for the student #. Student_Number. Error check to ensure that the value entered does fall within the expected range (1-50), and if it does not then ask them to reenter a value (make sure that the user could enter incorrect values multiple times without making the program stop). i) Display the results from step-h: "Student number XX is female/male and YY years old
Step by Step Solution
There are 3 Steps involved in it

Get step-by-step solutions from verified subject matter experts