

Using Microsoft Excel, calculate the hospital's Collection Period ratio, Average Collection Period ratio, Operating Margin ratio, Inventory
Question:
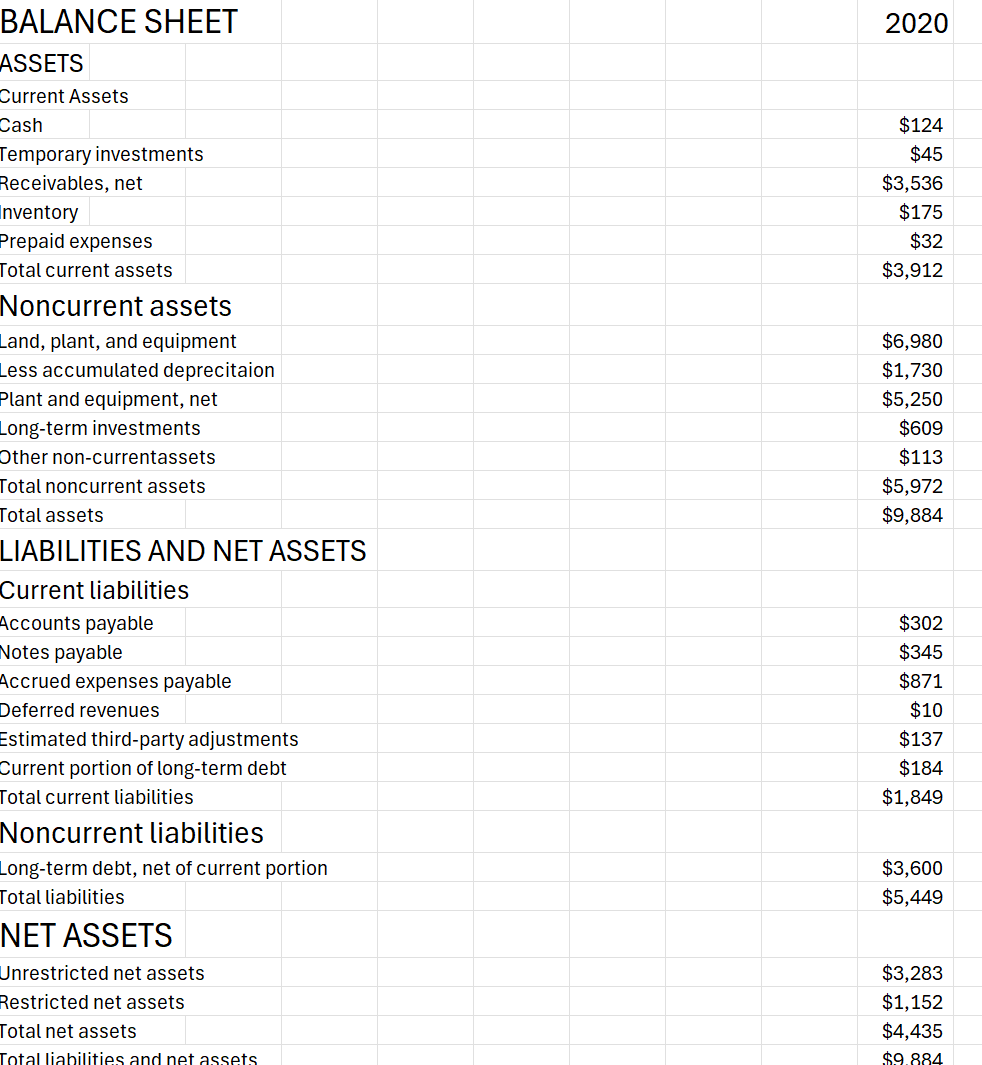
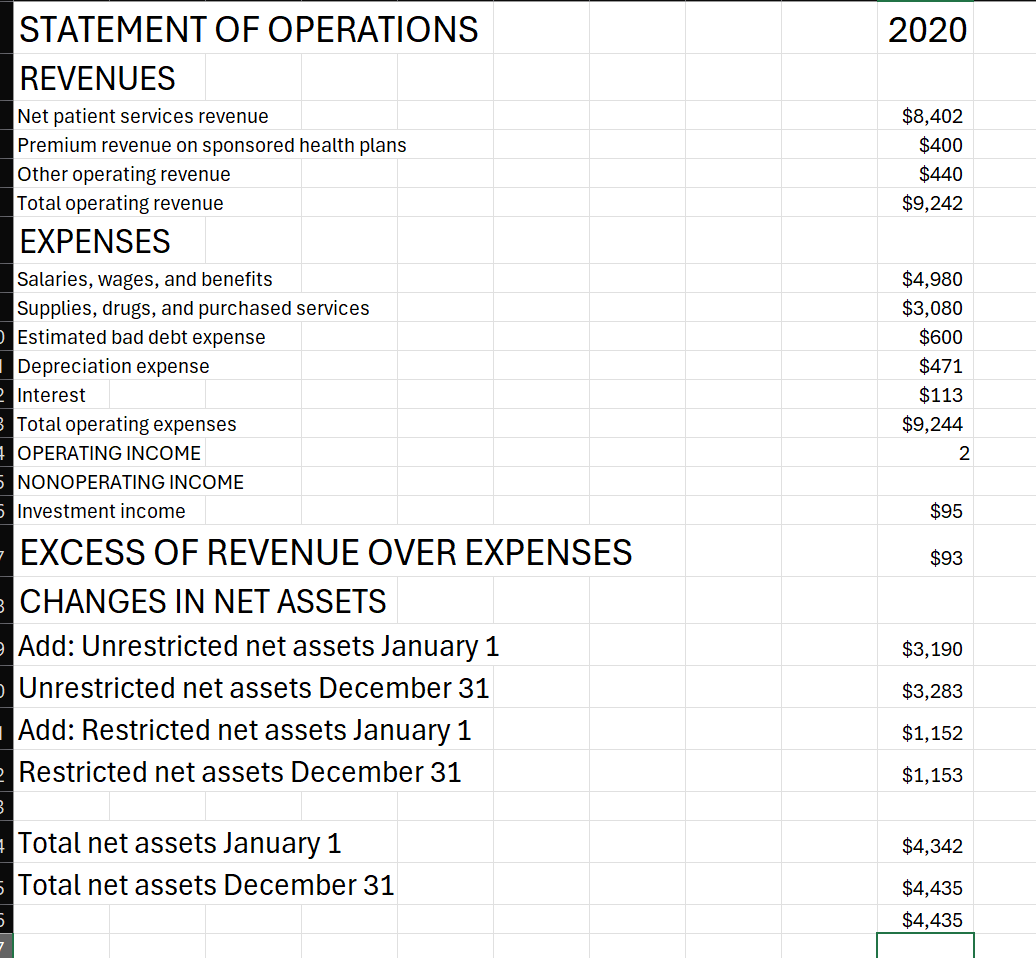
Using Microsoft Excel, calculate the hospital's Collection Period ratio, Average Collection Period ratio, Operating Margin ratio, Inventory Turnover Ratio using the Balance Sheet and Statement of Operations provided.
Compare our hospital's ratio numbers to the most recent Optum Median hospital numbers (provided). For each ratio, is our hospital better or worse than the median hospital? Lastly, explain what purpose is served by conducting the ratio analysis and comparing your results to the industry average?
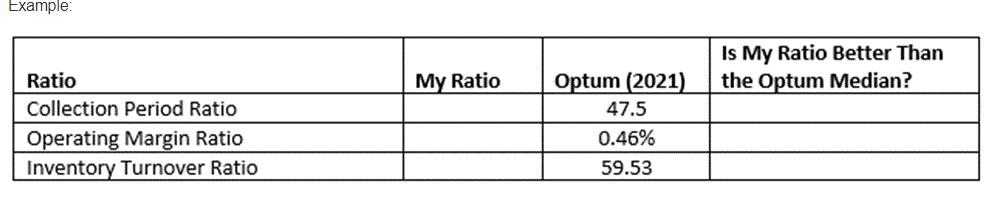
Optum 2021 Median Hospital Financial Ratios
- Average Collection Period 5
- Operating Margin 46%
- Inventory Turnover Ratio 53
Details: Use Excel or Word to organize your answers. Formulas for the required ratios are as follows:
Collection Period Ratio
Operating Margin
Inventory Turnover Ratio
Organize your table like the one in the example below, calculate your ratios and place your answers in the Current Ratio column, and state whether your hospital ratio is better than the Optum 2021 Median ratio.
Expert Answer:

