

Question: Using Microsoft Excel, how can I find covariance, eigenvalues and eigenvectors, determine principle components, make a scree plot, and make a score plot. I got
Using Microsoft Excel, how can I find covariance, eigenvalues and eigenvectors, determine principle components, make a scree plot, and make a score plot. I got the following after standardizing the values and running a data analysis for covariance but I'm not sure what to do or what it means
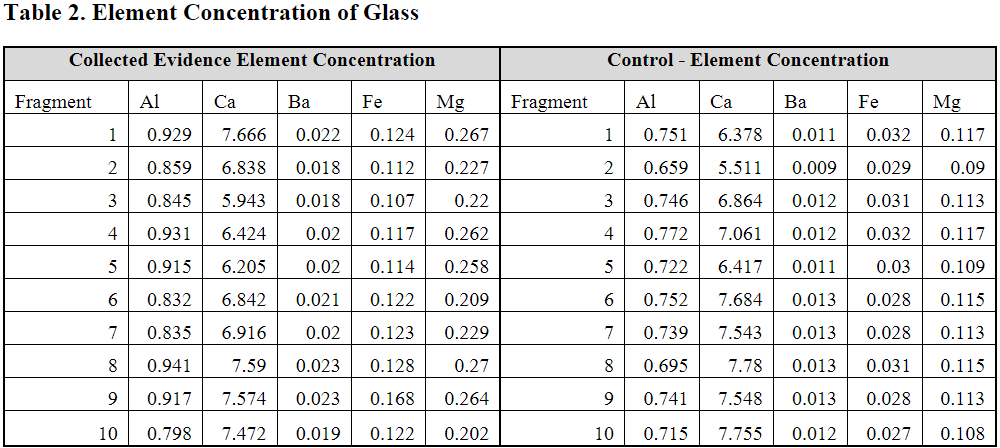
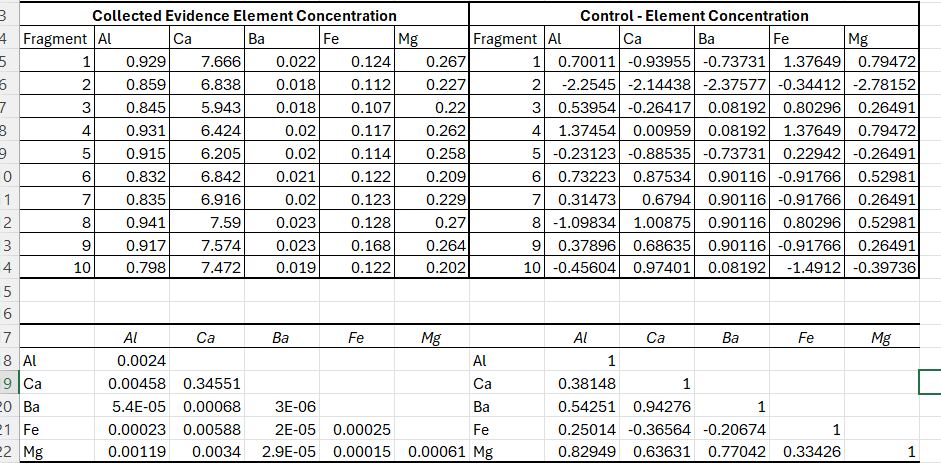
Table 2. Element Concentration of Glass Collected Evidence Element Concentration Control - Element Concentration Fragment Fragment Collected Evidence Element Concentration Control - Element Concentration Fragment |Al Ca Ba Fe Mg Fragment |Al Ca Ba Fe Mg 0.929 7.666 0.022 0.124 0.267 1 0.70011 -0.93955 -0.73731 1.37649 0.79472 2 0.859 6.838 0.018 0.112 0.227 NO -2.2545 -2.14438 -2.37577 -0.34412 -2.78152 3 0.845 5.943 0.018 0.107 0.22 3 0.53954 -0.26417 0.08192 0.80296 0.26491 4 0.931 6.424 0.02 0.117 0.262 4 1.37454 0.00959 0.08192 1.37649 0.79472 5 0.915 6.205 0.02 0.114 0.258 5 -0.23123 -0.88535 -0.73731 0.22942 -0.26491 6 0.832 6.842 0.021 0.122 0.209 6 0.73223 0.87534 0.90116 -0.91766 0.52981 O 0.835 6.916 0.02 0.123 0.229 7 0.31473 0.6794 0.90116 -0.91766 0.26491 2 0.941 7.59 0.023 0.128 0.27 8 -1.09834 1.00875 0.90116 0.80296 0.52981 9 0.37896 0.68635 0.90116 -0.91766 0.26491 W 9 0.917 7.574 0.023 0.168 0.264 10 0.798 7.472 0.019 0.122 0.202 10 -0.45604 0.97401 0.08192 -1.4912 -0.39736 6 Al Ca Ba Fe Mg Al Ca Ba Fe Mg 8 Al 0.0024 Al 1 9 Ca 0.00458 0.34551 Ca 0.38148 1 0 Ba 5.4E-05 0.00068 3E-06 Ba 0.54251 0.94276 1 1 Fe 0.00023 0.00588 2E-05 0.00025 Fe 0.25014 -0.36564 -0.20674 1 2 Mg 0.00119 0.0034 2.9E-05 0.00015 0.00061 Mg 0.82949 0.63631 0.77042 0.33426 1
Step by Step Solution
There are 3 Steps involved in it

Get step-by-step solutions from verified subject matter experts