

Question: Using Microsoft Excel, please do the following: Implementation Concerns Although you are free to work with the design of your worksheet, the worksheet should have
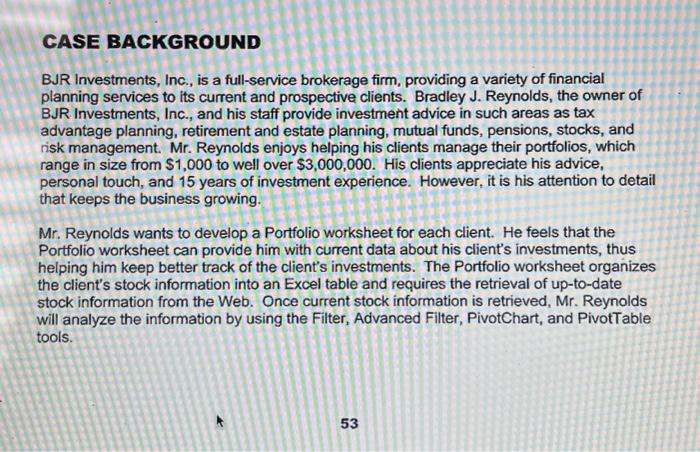
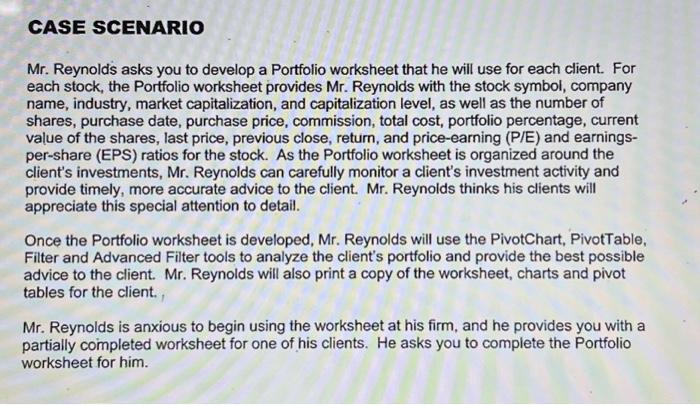
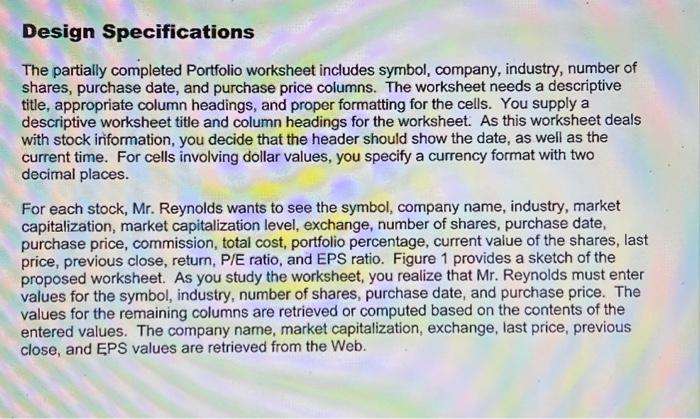
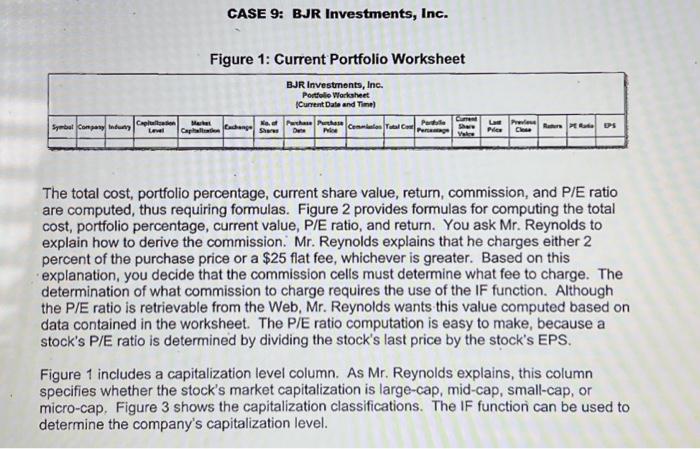
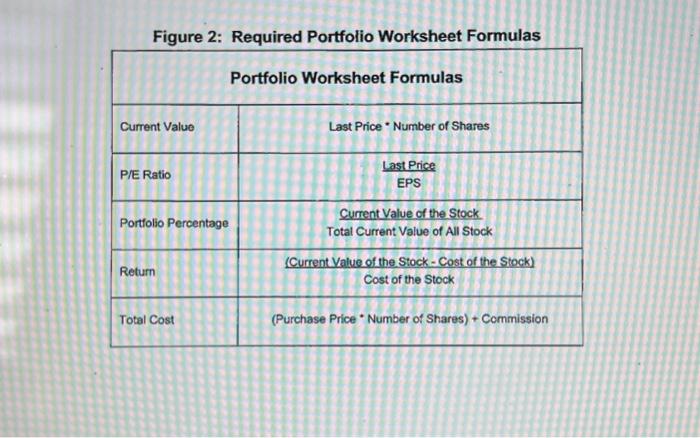
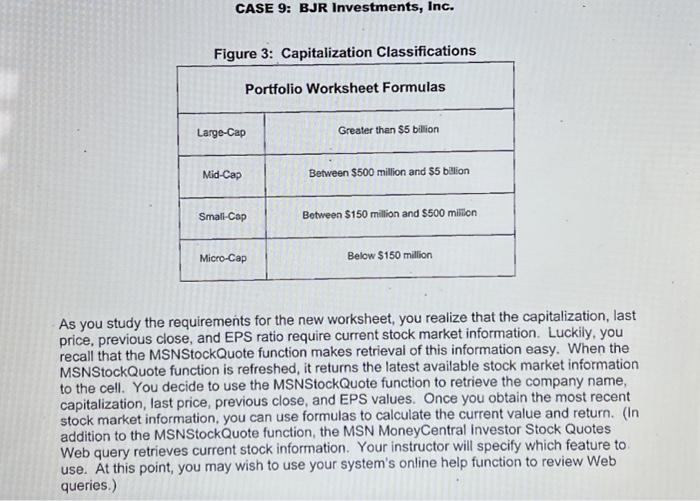
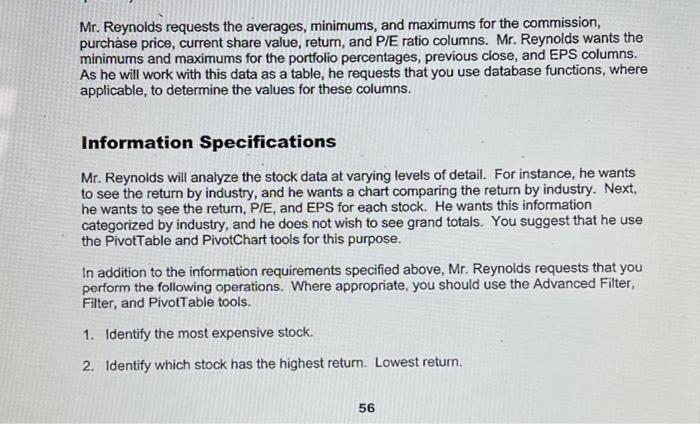
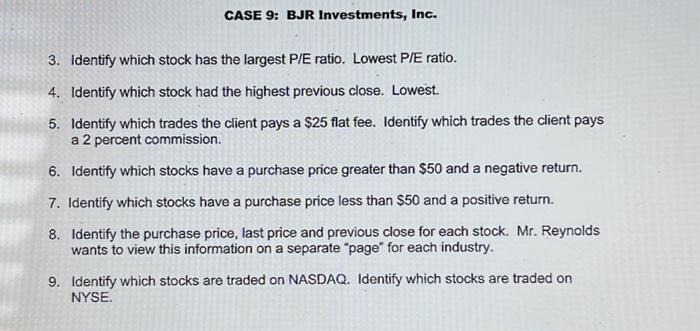
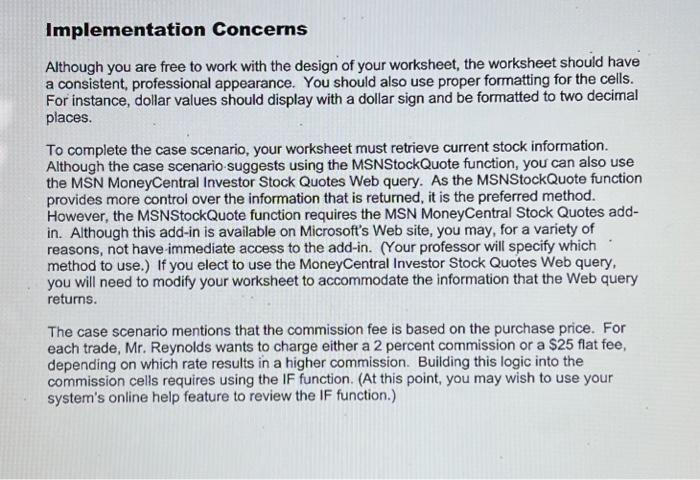
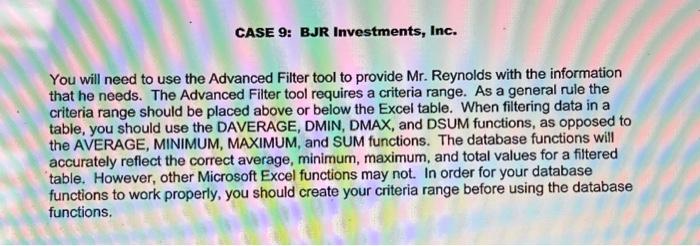
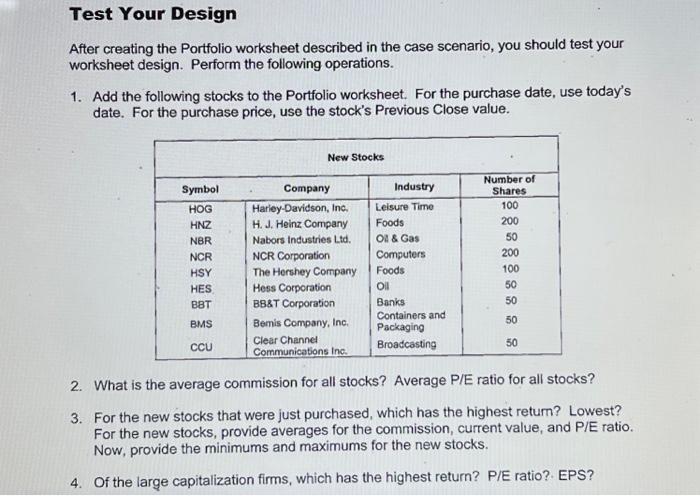

Implementation Concerns Although you are free to work with the design of your worksheet, the worksheet should have a consistent, professional appearance. You should also use proper formatting for the cells. For instance, dollar values should display with a dollar sign and be formatted to two decimal places. To complete the case scenario, your worksheet must retrieve current stock information. Although the case scenario-suggests using the MSNStockQuote function, you can also use the MSN MoneyCentral Investor Stock Quotes Web query. As the MSNStockQuote function provides more control over the information that is returned, it is the preferred method. However, the MSNStockQuote function requires the MSN MoneyCentral Stock Quotes addin. Although this add-in is available on Microsoft's Web site, you may, for a variety of reasons, not have-immediate access to the add-in. (Your professor will specify which method to use.) If you elect to use the MoneyCentral Investor Stock Quotes Web query, you will need to modify your worksheet to accommodate the information that the Web query returns. The case scenario mentions that the commission fee is based on the purchase price. For each trade, Mr. Reynolds wants to charge either a 2 percent commission or a \$25 flat fee, depending on which rate results in a higher commission. Building this logic into the commission cells requires using the IF function. (At this point, you may wish to use your system's online help feature to review the IF function.) Figure 2: Required Portfolio Worksheet Formulas Portfolio Worksheet Formulas \begin{tabular}{|l|c|} \hline Current Value & Last Price * Number of Shares \\ \hline P/E Ratio & EPSLastPrice \\ \hline Portfolio Percentage & TotalCurrentValueofAllStockCurrentValueoftheStock \\ \hline Return & (Current Value of the Stock - Cost of the Stock) \\ \hline Total Cost & Cost of the Stock \\ \hline \end{tabular} CASE 9: BJR Investments, Inc. Fiaure 3: Capitalization Classifications As you study the requirements for the new worksheet, you realize that the capitalization, last price, previous close, and EPS ratio require current stock market information. Luckily, you recall that the MSNStockQuote function makes retrieval of this information easy. When the MSNStockQuote function is refreshed, it returns the latest available stock market information to the cell. You decide to use the MSNStockQuote function to retrieve the company name, capitalization, last price, previous close, and EPS values. Once you obtain the most recent stock market information, you can use formulas to calculate the current value and return. (In addition to the MSNStockQuote function, the MSN MoneyCentral Investor Stock Quotes Web query retrieves current stock information. Your instructor will specify which feature to. use. At this point, you may wish to use your system's online help function to review Web queries.) You will need to use the Advanced Filter tool to provide Mr. Reynolds with the information that he needs. The Advanced Filter tool requires a criteria range. As a general rule the criteria range should be placed above or below the Excel table. When filtering data in a table, you should use the DAVERAGE, DMIN, DMAX, and DSUM functions, as opposed to the AVERAGE, MINIMUM, MAXIMUM, and SUM functions. The database functions will accurately reflect the correct average, minimum, maximum, and total values for a filtered table. However, other Microsoft Excel functions may not. In order for your database functions to work properly, you should create your criteria range before using the database functions. In order to satisfactorily complete this case, you should build the worksheet(s) as described in the case scenario and then prepare both written and oral presentations. Unless otherwise specified, submit the following deliverables to your professor. 1. A written report discussing any assumptions you have made about the case and the key elements of the case. Additionally, what features did you add to make the worksheet(s) more functional? User friendly? (Please note that these assumptions cannot violate any of the requirements specified above and must be approved by your professor.) 2. A printout of each worksheet. (This includes your chart and pivot tables.) 3. A printout of each worksheet's formulas. 4. An electronic, working copy of your workbook that meets the criteria mentioned in the case scenario and specifications sections. 5. Results for each question posed above. (A memo to your instructor discussing these results should also be provided.) 6. As mentioned above, you should prepare an oral presentation. (Your instructor will establish the time allocated for your presentation.) You should use a presentation package and discuss the key features of your workbook. Also, discuss how the workbook is beneficial for Mr. Reynolds. What additional information should be included in the workbook to make it more useful? CASE BACKGROUND BJR Investments, Inc., is a full-service brokerage firm, providing a variety of financial planning services to its current and prospective clients. Bradley J. Reynolds, the owner of BJR Investments, Inc., and his staff provide investment advice in such areas as tax advantage planning, retirement and estate planning, mutual funds, pensions, stocks, and risk management. Mr. Reynolds enjoys helping his clients manage their portfolios, which range in size from $1,000 to well over $3,000,000. His clients appreciate his advice, personal touch, and 15 years of investment experience. However, it is his attention to detail that keeps the business growing. Mr. Reynolds wants to develop a Portfolio worksheet for each client. He feels that the Portfolio worksheet can provide him with current data about his client's investments, thus helping him keep better track of the client's investments. The Portfolio worksheet organizes the client's stock information into an Excel table and requires the retrieval of up-to-date stock information from the Web. Once current stock information is retrieved, Mr. Reynolds will analyze the information by using the Filter, Advanced Filter, PivotChart, and PivotTable tools. CASE BJR Investments, Inc. Spreadsheet Case Difficulty Rating: SKILLS CHECK You should review the following areas: SPREADSHEET SKILLS Advanced Filter DAVERAGE Function DMAX Function DMin Function DSUM Function Excel Table Filter IF Function PivotChart PivotTable Range Name Web Query Worksheet Formatting CASE 9: BJR Investments, Inc. Figure 1: Current Portfolio Worksheet The total cost, portfolio percentage, current share value, return, commission, and P/E ratio are computed, thus requiring formulas. Figure 2 provides formulas for computing the total cost, portfolio percentage, current value, P/E ratio, and return. You ask Mr. Reynolds to explain how to derive the commission. Mr. Reynolds explains that he charges either 2 percent of the purchase price or a $25 flat fee, whichever is greater. Based on this explanation, you decide that the commission cells must determine what fee to charge. The determination of what commission to charge requires the use of the IF function. Although the P/E ratio is retrievable from the Web, Mr. Reynolds wants this value computed based on data contained in the worksheet. The P/E ratio computation is easy to make, because a stock's P/E ratio is determined by dividing the stock's last price by the stock's EPS. Figure 1 includes a capitalization level column. As Mr. Reynolds explains, this column specifies whether the stock's market capitalization is large-cap, mid-cap, small-cap, or micro-cap. Figure 3 shows the capitalization classifications. The IF function can be used to determine the company's capitalization level. Test Your Design After creating the Portfolio worksheet described in the case scenario, you should test your worksheet design. Perform the following operations. 1. Add the following stocks to the Portfolio worksheet. For the purchase date, use today's date. For the purchase price, use the stock's Previous Close value. 2. What is the average commission for all stocks? Average P/E ratio for all stocks? 3. For the new stocks that were just purchased, which has the highest return? Lowest? For the new stocks, provide averages for the commission, current value, and P/E ratio. Now, provide the minimums and maximums for the new stocks. 4. Of the large capitalization firms, which has the highest return? P/E ratio?. EPS? CASE 9: BJR Investments, Inc. 3. Identify which stock has the largest P/E ratio. Lowest P/E ratio. 4. Identify which stock had the highest previous close. Lowest. 5. Identify which trades the client pays a $25 flat fee. Identify which trades the client pays a 2 percent commission. 6. Identify which stocks have a purchase price greater than $50 and a negative return. 7. Identify which stocks have a purchase price less than $50 and a positive return. 8. Identify the purchase price, last price and previous close for each stock. Mr. Reynolds wants to view this information on a separate "page" for each industry. 9. Identify which stocks are traded on NASDAQ. Identify which stocks are traded on NYSE. Mr. Reynolds asks you to develop a Portfolio worksheet that he will use for each client. For each stock, the Portfolio worksheet provides Mr. Reynolds with the stock symbol, company name, industry, market capitalization, and capitalization level, as well as the number of shares, purchase date, purchase price, commission, total cost, portfolio percentage, current value of the shares, last price, previous close, return, and price-earning (P/E) and earningsper-share (EPS) ratios for the stock. As the Portfolio worksheet is organized around the client's investments, Mr. Reynolds can carefully monitor a client's investment activity and provide timely, more accurate advice to the client. Mr. Reynolds thinks his clients will appreciate this special attention to detail. Once the Portfolio worksheet is developed, Mr. Reynolds will use the PivotChart, PivotTable, Filter and Advanced Filter tools to analyze the client's portfolio and provide the best possible advice to the client. Mr. Reynolds will also print a copy of the worksheet, charts and pivot tables for the client. Mr. Reynolds is anxious to begin using the worksheet at his firm, and he provides you with a partially completed worksheet for one of his clients. He asks you to complete the Portfolio worksheet for him. 5. Which mid-capitalization firm has the highest current value for its stock? Lowest? 6. Based on portfolio percentage, identify the top five firms with which the client is invested. 7. Based on the information provided in the Portfolio worksheet, which stock(s) would you recommended eliminating from the portfolio? 58 CASE 9: BJR Investments, Inc. 8. Mr. Reynolds wants a count of the companies by capitalization size. He also wants to view this information on a separate "page" for each industry. Mr. Reynolds requests the averages, minimums, and maximums for the commission, purchase price, current share value, return, and P/E ratio columns. Mr. Reynolds wants the minimums and maximums for the portfolio percentages, previous close, and EPS columns. As he will work with this data as a table, he requests that you use database functions, where applicable, to determine the values for these columns. Information Specifications Mr. Reynolds will analyze the stock data at varying levels of detail. For instance, he wants to see the return by industry, and he wants a chart comparing the return by industry. Next, he wants to see the return, P/E, and EPS for each stock. He wants this information categorized by industry, and he does not wish to see grand totals. You suggest that he use the PivotTable and PivotChart tools for this purpose. In addition to the information requirements specified above, Mr. Reynolds requests that you perform the following operations. Where appropriate, you should use the Advanced Filter, Filter, and PivotTable tools. 1. Identify the most expensive stock. 2. Identify which stock has the highest return. Lowest return. Design Specifications The partially completed Portfolio worksheet includes symbol, company, industry, number of shares, purchase date, and purchase price columns. The worksheet needs a descriptive title, appropriate column headings, and proper formatting for the cells. You supply a descriptive worksheet title and column headings for the worksheet. As this worksheet deals with stock information, you decide that the header should show the date, as well as the current time. For cells involving dollar values, you specify a currency format with two decimal places. For each stock, Mr. Reynolds wants to see the symbol, company name, industry, market capitalization, market capitalization level, exchange, number of shares, purchase date, purchase price, commission, total cost, portfolio percentage, current value of the shares, last price, previous close, return, P/E ratio, and EPS ratio. Figure 1 provides a sketch of the proposed worksheet. As you study the worksheet, you realize that Mr. Reynolds must enter values for the symbol, industry, number of shares, purchase date, and purchase price. The values for the remaining columns are retrieved or computed based on the contents of the entered values. The company name, market capitalization, exchange, last price, previous close, and EPS values are retrieved from the Web
Step by Step Solution
There are 3 Steps involved in it

Get step-by-step solutions from verified subject matter experts