

Question: Using Minitab, please explain 9 and 10 ENMA 614 - Quality Systems Design Summer 2024 Examination One Chapters 1 through 7,9 9. The data in
Using Minitab, please explain 9 and 10
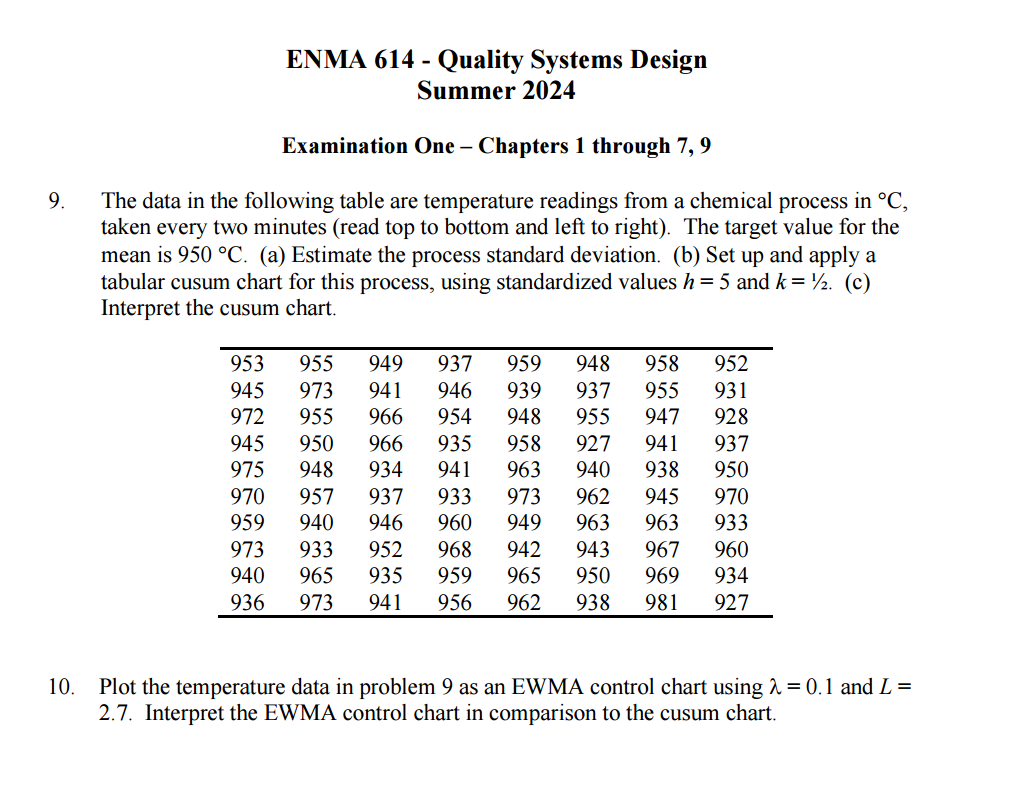
ENMA 614 - Quality Systems Design Summer 2024 Examination One Chapters 1 through 7,9 9. The data in the following table are temperature readings from a chemical process in C, taken every two minutes (read top to bottom and left to right). The target value for the mean is 950 C. (a) Estimate the process standard deviation. (b) Set up and apply a tabular cusum chart for this process, using standardized values =5 and k= '2. (c) Interpret the cusum chart. 953 955 949 937 959 948 958 952 945 973 941 946 939 937 955 931 972 955 966 954 948 955 947 928 945 950 966 935 958 927 941 937 975 948 934 941 963 940 938 950 970 957 937 933 973 962 945 970 959 940 946 960 949 963 963 933 973 933 952 968 942 943 967 960 940 965 935 959 965 950 969 934 936 973 941 956 962 938 981 927 10. Plot the temperature data in problem 9 as an EWMA control chart using A=0.1 and L = 2.7. Interpret the EWMA control chart in comparison to the cusum chart
Step by Step Solution
There are 3 Steps involved in it

Get step-by-step solutions from verified subject matter experts