

Question: Using Minitab please explain A measurement systems study involving 25 parts, three measuring units, and two replicate measurements per part is shown in the following
Using Minitab please explain
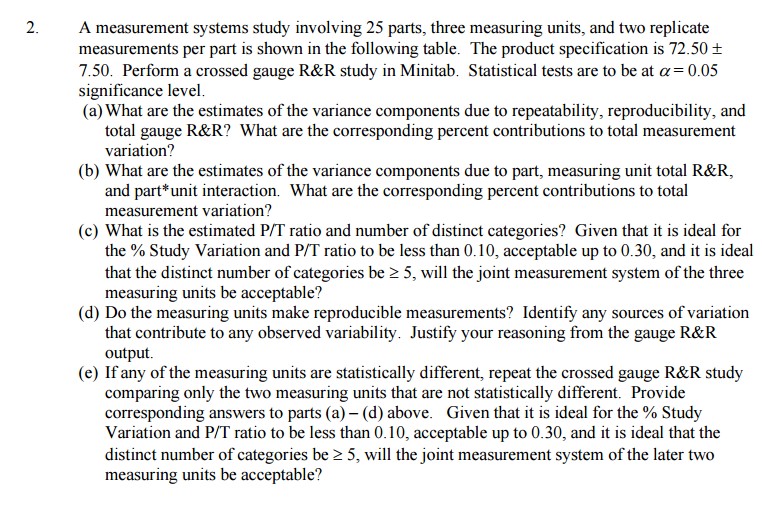
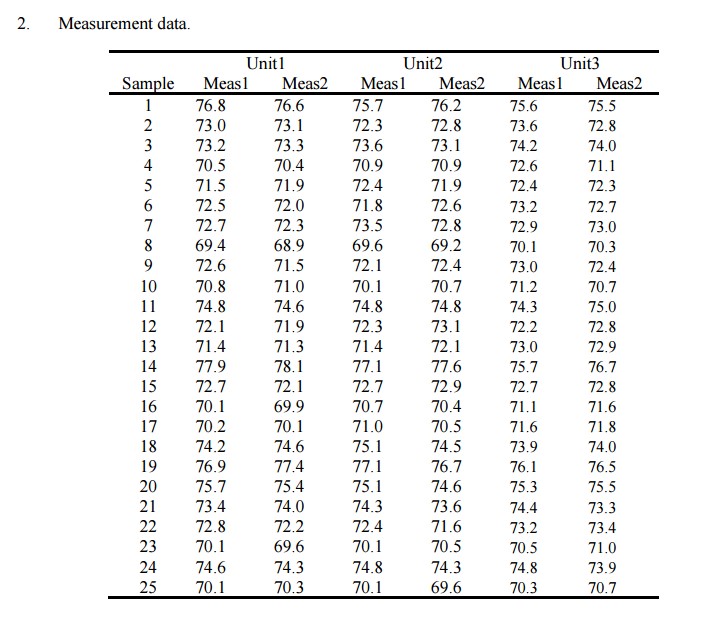
A measurement systems study involving 25 parts, three measuring units, and two replicate measurements per part is shown in the following table. The product specification 1s 72.50 7.50. Perform a crossed gauge R&R study in Minitab. Statistical tests are to be at o= 0.05 significance level. (a) What are the estimates of the variance components due to repeatability, reproducibility, and total gauge R&R? What are the corresponding percent contributions to total measurement variation? (b) What are the estimates of the variance components due to part, measuring unit total R&R, and part*unit interaction. What are the corresponding percent contributions to total measurement variation? (c) What is the estimated P/T ratio and number of distinct categories? Given that it is ideal for the % Study Variation and P/T ratio to be less than 0.10, acceptable up to 0.30, and 1t 1s 1deal that the distinct number of categories be = 5, will the joint measurement system of the three measuring units be acceptable? (d) Do the measuring units make reproducible measurements? Identify any sources of variation that contribute to any observed variability. Justify your reasoning from the gauge R&R output. (e) If any of the measuring units are statistically different, repeat the crossed gauge R&R study comparing only the two measuring units that are not statistically different. Provide corresponding answers to parts (a) (d) above. Given that it is ideal for the % Study Variation and P/T ratio to be less than 0.10, acceptable up to 0.30, and it is ideal that the distinct number of categories be = 5, will the joint measurement system of the later two measuring units be acceptable? 2. Measurement data. Unit 1 Unit2 Unit3 Sample Meas1 Meas2 Meas 1 Meas2 Meas1 Meas2 76.8 76.6 75.7 76.2 75.6 75.5 73.0 73.1 72.3 72.8 73.6 72.8 73.2 73.3 73.6 73.1 74.2 74.0 70.5 70.4 70.9 70.9 72.6 71.1 71.5 71.9 72.4 71.9 72.4 72.3 72.5 72.0 71.8 72.6 73.2 72.7 72.7 72.3 73.5 72.8 72.9 73.0 8 69.4 68.9 69.6 69.2 70.1 70.3 9 72.6 71.5 72.1 72.4 73.0 72.4 10 70.8 71.0 70.1 70.7 71.2 70.7 11 74.8 74.6 74.8 74.8 74.3 75.0 12 72.1 71.9 72.3 73.1 72.2 72.8 71.4 71.3 71.4 72.1 73.0 72.9 14 77.9 78.1 77.1 77.6 75.7 76.7 15 72.7 72.1 72.7 72.9 72.7 72.8 16 70.1 69.9 70.7 70.4 71.1 71.6 17 70.2 70.1 71.0 70.5 71.6 71.8 18 74.2 74.6 75.1 74.5 73.9 74.0 19 76.9 77.4 77. 1 76.7 76.1 76.5 20 75.7 75.4 75.1 74.6 75.3 75.5 21 73.4 74.0 74.3 73.6 74.4 73.3 72.8 72.2 72.4 71.6 73.2 73.4 23 70.1 69.6 70.1 70.5 70.5 71.0 24 74.6 74.3 74.8 74.3 74.8 73.9 25 70.1 70.3 70.1 69.6 70.3 70.7
Step by Step Solution
There are 3 Steps involved in it

Get step-by-step solutions from verified subject matter experts