

Question: Using MS Excel, calculate financial ratios for DSS for each of the years for which accounts are available. Based on the ratios calculated, identify (and
-
Using MS Excel, calculate financial ratios for DSS for each of the years for which accounts are available.
-
Based on the ratios calculated, identify (and explain) clearly DSSs strengths and weaknesses.
-
Explain fully the advice you would offer Tim to improve DSSs performance over the next one or two years? (This must be based on your analysis above)
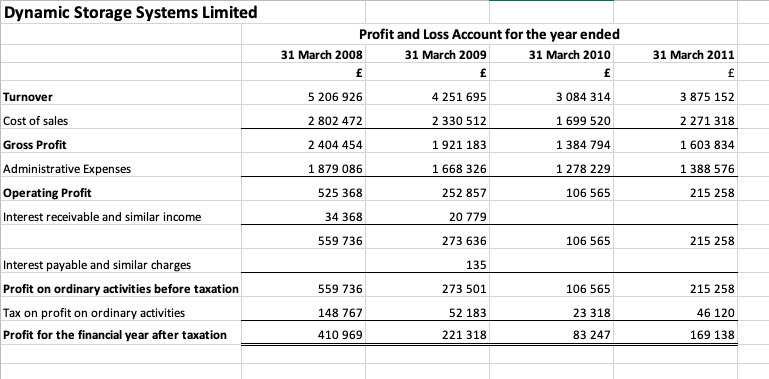
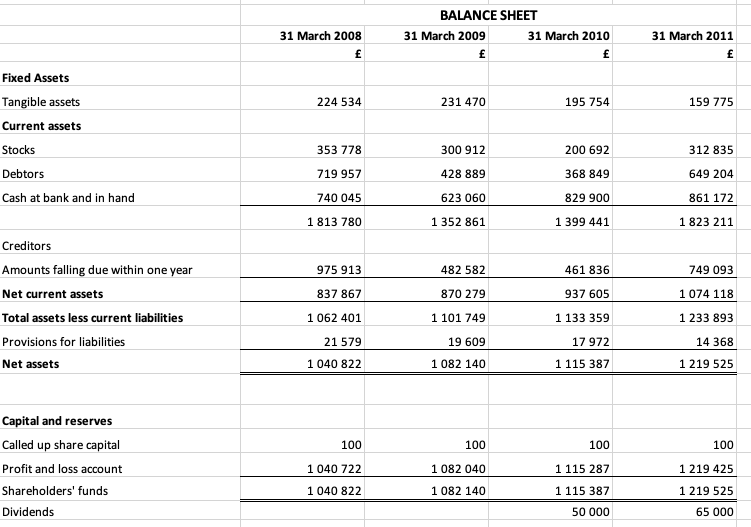
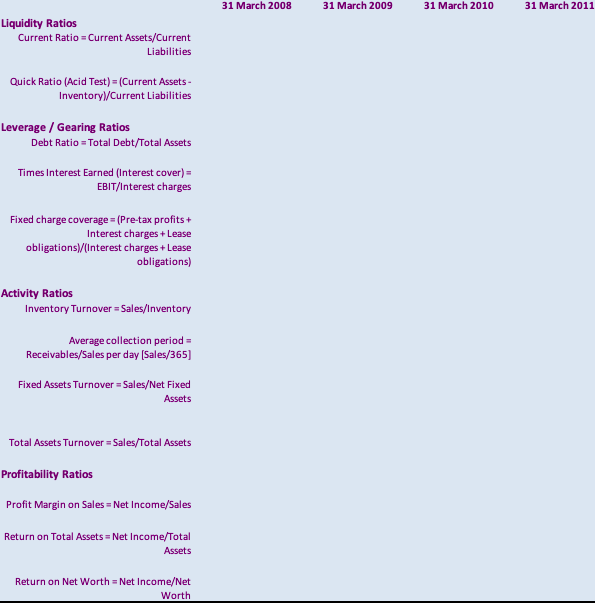
Dynamic Storage Systems Limited 31 March 2011 3 875 152 2 271 318 Profit and Loss Account for the year ended 31 March 2008 31 March 2009 31 March 2010 5 206 926 4 251 695 3 084 314 2 802 472 2 330 512 1699 520 2 404 454 1921 183 1 384 794 1 879 086 1668 326 1 278 229 Turnover Cost of sales Gross Profit Administrative Expenses Operating Profit Interest receivable and similar income 1 603 834 1 388 576 525 368 252 857 106 565 215 258 34 368 20 779 559 736 273 636 106 565 215 258 135 559 736 273 501 106 565 215 258 Interest payable and similar charges Profit on ordinary activities before taxation Tax on profit on ordinary activities Profit for the financial year after taxation 148 767 52 183 23 318 46 120 410 969 221 318 83 247 169 138 31 March 2008 BALANCE SHEET 31 March 2009 31 March 2010 31 March 2011 224 534 231 470 195 754 159 775 Fixed Assets Tangible assets Current assets Stocks Debtors Cash at bank and in hand 353 778 300 912 312 835 200 692 368 849 719 957 428 889 649 204 740 045 623 060 829 900 861 172 1 813 780 1 352 861 1 399 441 1 823 211 Creditors 975 913 482 582 461 836 749 093 837 867 870 279 937 605 1 074 118 Amounts falling due within one year Net current assets Total assets less current liabilities Provisions for liabilities Net assets 1 062 401 1 101 749 1 133 359 1 233 893 21 579 19 609 17 972 14 368 1 040 822 1 082 140 1 115 387 1 219 525 100 100 100 100 Capital and reserves Called up share capital Profit and loss account Shareholders' funds Dividends 1 040 722 1 082 040 1 115 287 1 219 425 1 040 822 1 082 140 1 115 387 1 219 525 50 000 65 000 31 March 2008 31 March 2009 31 March 2010 31 March 2011 Liquidity Ratios Current Ratio = Current Assets/Current Liabilities Quick Ratio (Acid Test) = (Current Assets- Inventory)/Current Liabilities Leverage / Gearing Ratios Debt Ratio = Total Debt/Total Assets Times Interest Earned (Interest cover) = EBIT/Interest charges Fixed charge coverage = (Pre-tax profits + Interest charges +Lease obligations)/(Interest charges + Lease obligations) Activity Ratios Inventory Turnover =Sales/Inventory Average collection period = Receivables/Sales per day (Sales/365) Fixed Assets Turnover = Sales/Net Fixed Assets Total Assets Turnover = Sales/Total Assets Profitability Ratios Profit Margin on Sales - Net Income/Sales Return on Total Assets = Net Income/Total Assets Return on Net Worth = Net Income/Net Worth Dynamic Storage Systems Limited 31 March 2011 3 875 152 2 271 318 Profit and Loss Account for the year ended 31 March 2008 31 March 2009 31 March 2010 5 206 926 4 251 695 3 084 314 2 802 472 2 330 512 1699 520 2 404 454 1921 183 1 384 794 1 879 086 1668 326 1 278 229 Turnover Cost of sales Gross Profit Administrative Expenses Operating Profit Interest receivable and similar income 1 603 834 1 388 576 525 368 252 857 106 565 215 258 34 368 20 779 559 736 273 636 106 565 215 258 135 559 736 273 501 106 565 215 258 Interest payable and similar charges Profit on ordinary activities before taxation Tax on profit on ordinary activities Profit for the financial year after taxation 148 767 52 183 23 318 46 120 410 969 221 318 83 247 169 138 31 March 2008 BALANCE SHEET 31 March 2009 31 March 2010 31 March 2011 224 534 231 470 195 754 159 775 Fixed Assets Tangible assets Current assets Stocks Debtors Cash at bank and in hand 353 778 300 912 312 835 200 692 368 849 719 957 428 889 649 204 740 045 623 060 829 900 861 172 1 813 780 1 352 861 1 399 441 1 823 211 Creditors 975 913 482 582 461 836 749 093 837 867 870 279 937 605 1 074 118 Amounts falling due within one year Net current assets Total assets less current liabilities Provisions for liabilities Net assets 1 062 401 1 101 749 1 133 359 1 233 893 21 579 19 609 17 972 14 368 1 040 822 1 082 140 1 115 387 1 219 525 100 100 100 100 Capital and reserves Called up share capital Profit and loss account Shareholders' funds Dividends 1 040 722 1 082 040 1 115 287 1 219 425 1 040 822 1 082 140 1 115 387 1 219 525 50 000 65 000 31 March 2008 31 March 2009 31 March 2010 31 March 2011 Liquidity Ratios Current Ratio = Current Assets/Current Liabilities Quick Ratio (Acid Test) = (Current Assets- Inventory)/Current Liabilities Leverage / Gearing Ratios Debt Ratio = Total Debt/Total Assets Times Interest Earned (Interest cover) = EBIT/Interest charges Fixed charge coverage = (Pre-tax profits + Interest charges +Lease obligations)/(Interest charges + Lease obligations) Activity Ratios Inventory Turnover =Sales/Inventory Average collection period = Receivables/Sales per day (Sales/365) Fixed Assets Turnover = Sales/Net Fixed Assets Total Assets Turnover = Sales/Total Assets Profitability Ratios Profit Margin on Sales - Net Income/Sales Return on Total Assets = Net Income/Total Assets Return on Net Worth = Net Income/Net Worth
Step by Step Solution
There are 3 Steps involved in it

Get step-by-step solutions from verified subject matter experts