

Question: Using MS Excel conduct a regression analysis to assess the strength of the relationship between tears and run size. What conclusions can you draw? Explain
Using MS Excel conduct a regression analysis to assess the strength of the relationship between tears and run size. What conclusions can you draw? Explain your answer.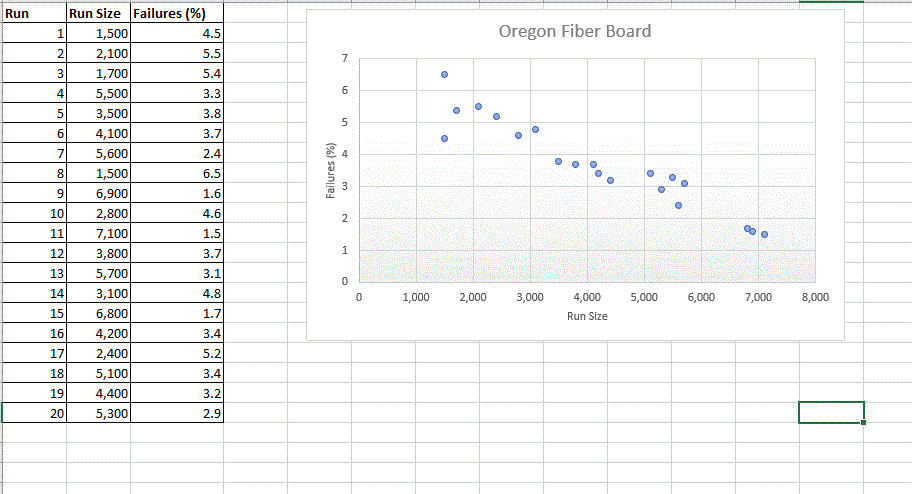
Step by Step Solution
There are 3 Steps involved in it
1 Expert Approved Answer
Step: 1 Unlock

Question Has Been Solved by an Expert!
Get step-by-step solutions from verified subject matter experts
Step: 2 Unlock
Step: 3 Unlock