

Question: Using MS Excel, find the following for the given table. Plus, write formulas on the answer.!! Discount Delivery ? ? Level ? Date Fruit 11/1/2018
Using MS Excel, find the following for the given table. Plus, write formulas on the answer.!!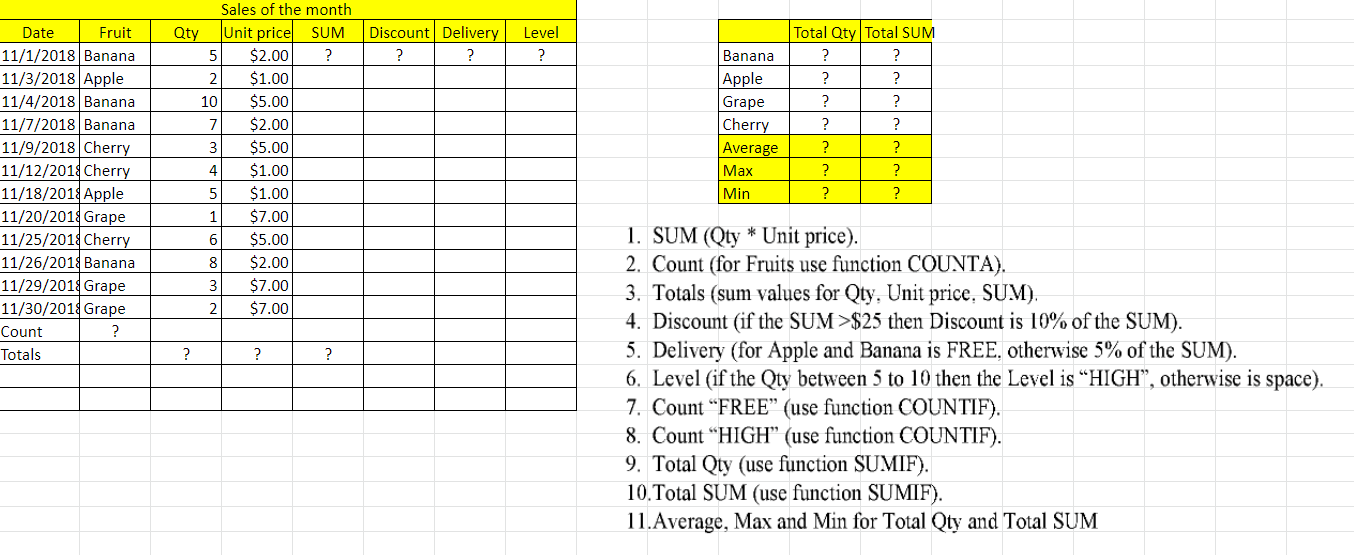
Discount Delivery ? ? Level ? Date Fruit 11/1/2018 Banana 11/3/2018 Apple 11/4/2018 Banana 11/7/2018 Banana 11/9/2018 Cherry 11/12/2014 Cherry 11/18/2018 Apple 11/20/2018 Grape 11/25/2018 Cherry 11/26/2018 Banana 11/29/2018 Grape 11/30/2018 Grape Count ? Totals Sales of the month Qty Unit price SUM 5 $2.00 ? 2 $1.00 10 $5.00 7 $2.00 3 $5.00 4 $1.00 5 $1.00 1 $7.00 6 $5.00 8 $2.00 3 $7.00 2 $7.00 Banana Apple Grape Cherry Average | Max Min Total Qty Total SUM ? ? ? ? ? ? ? ? ? ? ? ? ? ? ? 1. SUM (Qty * Unit price). 2. Count (for Fruits use function COUNTA). 3. Totals (sum values for Qty. Unit price. SUM). 4. Discount (if the SUM >$25 then Discount is 10% of the SUM). 5. Delivery (for Apple and Banana is FREE, otherwise 5% of the SUM). 6. Level (if the Qty between 5 to 10 then the Level is HIGH, otherwise is space). 7. Count FREE (use function COUNTIF). 8. Count "HIGH" (use function COUNTIF). 9. Total Qty (use function SUMIF). 10.Total SUM (use function SUMIF). 11.Average, Max and Min for Total Qty and Total SUM
Step by Step Solution
There are 3 Steps involved in it

Get step-by-step solutions from verified subject matter experts