

Question: Using MySQL, design a database project with an educational attainment demand forecast for the state of California for years greater than 2010. The demand forecast
Using MySQL, design a database project with an educational attainment "demand" forecast for the state of California for years greater than 2010. The demand forecast is the expected number of population who have obtained a certain level of education. The population is divided into age groups and education attainment is divided into different levels. The population of each group is estimated for each year up to year 2050. Implement the following steps to obtain and educational demand forecast for the state of California. The files can be downloaded below.
- Create a ca_pop schema in your MySQL database.
- Using your ca_pop schema, create an "educational_attainment" table which columns match the columns in the Excel spreadsheet "ca_pop_educational_attainment.csv".
- Using your ca_pop schema, create a "pop_proj" table which columns match the columns in the Excel spreadsheet "pop_proj_1970_2050.csv".
- Using the data loading technique for a csv file you learned in Module 1, load the data in "ca_pop_educational_attainment.csv" into the table "educational_attainment".
- Using the data loading technique for a csv file you learned in Module 1, load the data in "pop_proj_1970_2050.csv" into the table "pop_proj".
- Write a query to select the total population in each age group.
- Use the query from Step 6 as a subquery to find each type of education attained by the population in that age group and the fraction of the population of that age group that has that educational attainment. Label the fraction column output as "coefficient". For instance, the fraction of the population in age group 00 - 17 who has an education attainment of Bachelor's degree or higher is 0.0015, which is the "coefficient".
- Create a demographics table from the SQL query from Step 7.
- Create a query on the "pop_proj" table which shows the population count by date_year and age.
- Use that query from Step 9 as a subquery and join it to the demographics table using the following case statement:
demographics.age = case when temp_pop.age 18 then '00 to 17' when temp_pop.age 64 then '65 to 80+' else '18 to 64' end
"temp_pop" is an alias for the subquery. Use the following calculation for the demand output:
round(sum(temp_pop.total_pop * demographics.coefficient)) as demand
Output the demand grouped by year and education level.
Write each query you used in Steps 1 - 8 in a text file. If a query produced a result set, then list the first ten rows of each row set after the query.
The following are screenshots of above mentioned Excel spreadsheets and their columns:
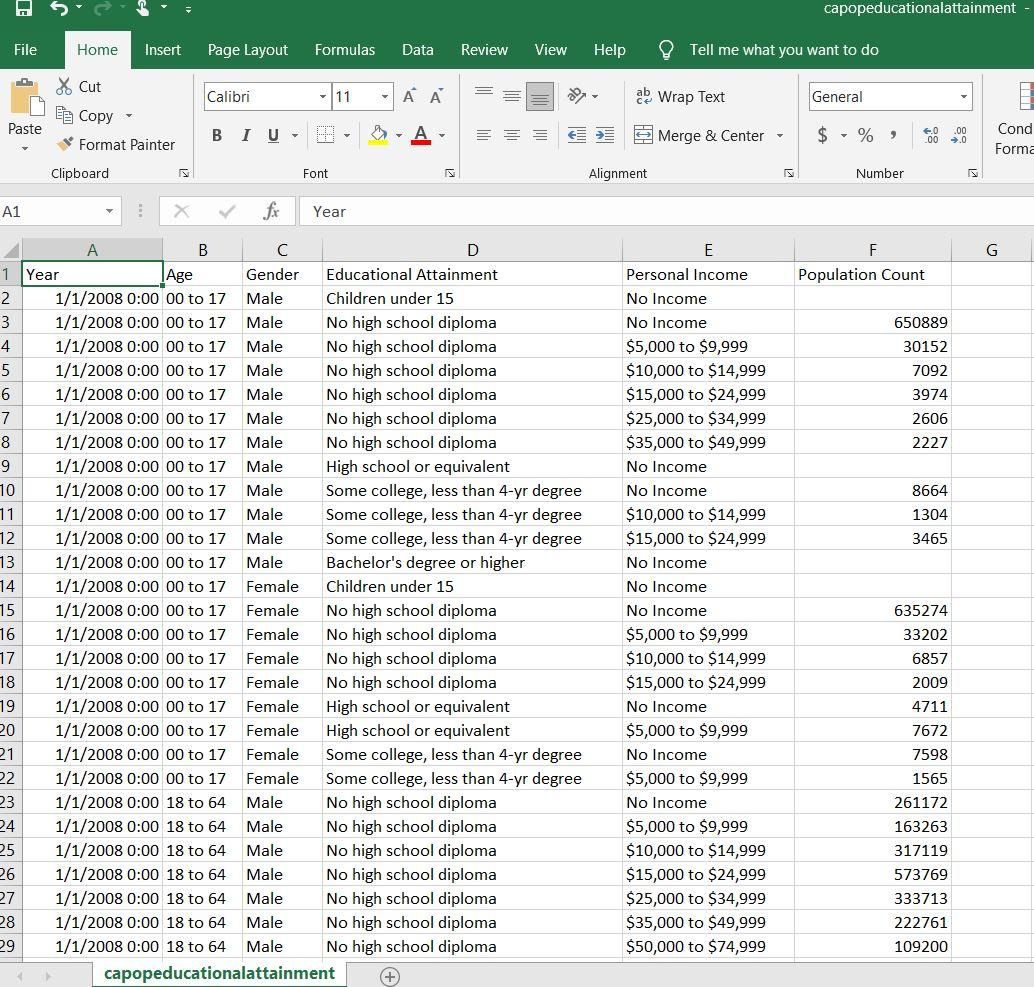
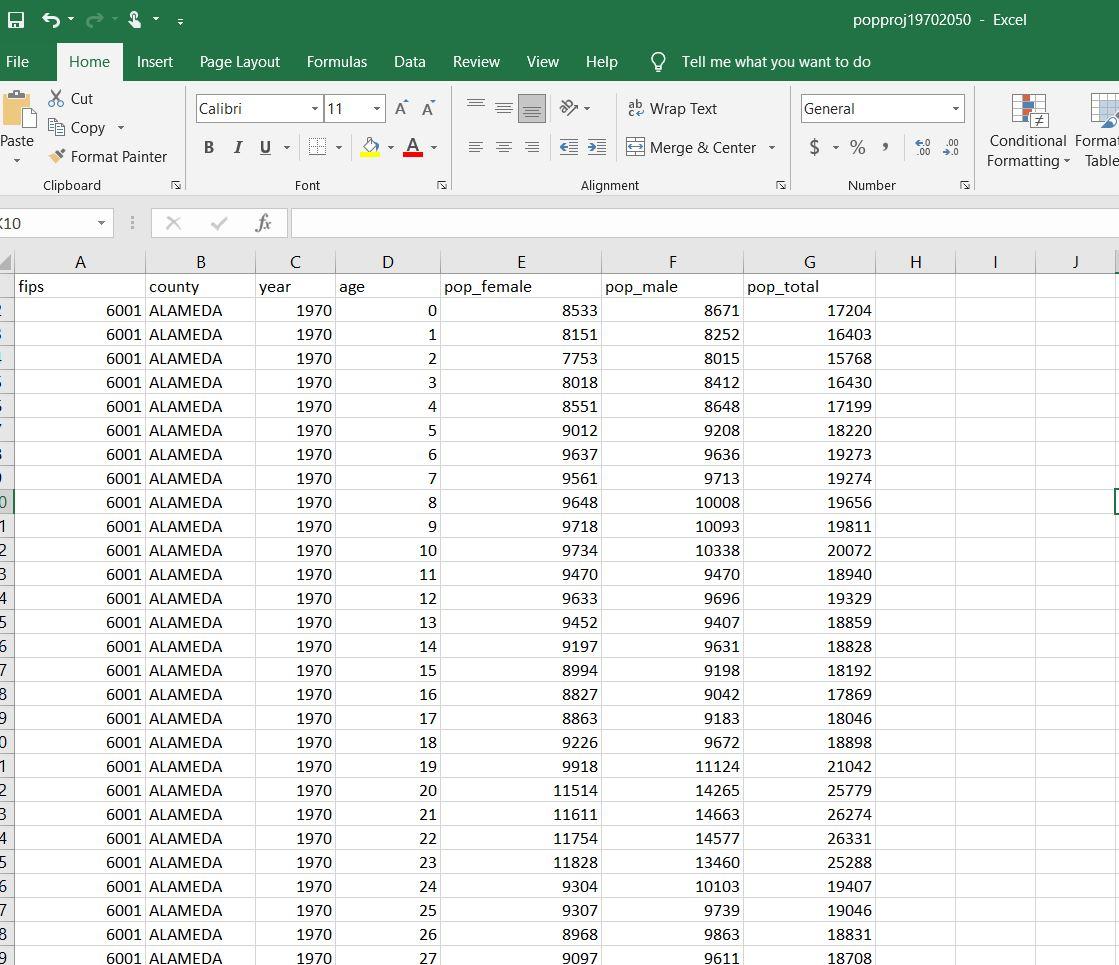
capopeducationalattainment File Home Insert Page Layout Formulas Data Review View Help Tell me what you want to do Calibri 11 ab Wrap Text General & Cut E Copy Format Painter Paste BIU- A === Merge & Center $ - %, 00 Cond Forma Clipboard Font Alignment Number A1 X fic Year G F Population Count 650889 30152 7092 3974 2606 2227 8664 1304 3465 B D 1 Year | Age Gender Educational Attainment 2 1/1/2008 0:00 00 to 17 Male Children under 15 3 1/1/2008 0:00 00 to 17 Male No high school diploma 4 1/1/2008 0:00 00 to 17 Male No high school diploma 5 1/1/2008 0:00 00 to 17 Male No high school diploma 6 1/1/2008 0:00 00 to 17 Male No high school diploma 7 1/1/2008 0:00 00 to 17 Male No high school diploma 8 1/1/2008 0:00 00 to 17 Male No high school diploma 9 1/1/2008 0:00 00 to 17 Male High school or equivalent 10 1/1/2008 0:00 00 to 17 Male Some college, less than 4-yr degree 11 1/1/2008 0:00 00 to 17 Male Some college, less than 4-yr degree 12 1/1/2008 0:00 00 to 17 Male Some college, less than 4-yr degree 13 1/1/2008 0:00 00 to 17 Male Bachelor's degree or higher 14 1/1/2008 0:00 00 to 17 Female Children under 15 15 1/1/2008 0:00 00 to 17 Female No high school diploma 16 1/1/2008 0:00 00 to 17 Female No high school diploma 17 1/1/2008 0:00 00 to 17 Female No high school diploma 18 1/1/2008 0:00 00 to 17 Female No high school diploma 19 1/1/2008 0:00 00 to 17 Female High school or equivalent 20 1/1/2008 0:00 00 to 17 Female High school or equivalent 21 1/1/2008 0:00 00 to 17 Female Some college, less than 4-yr degree 22 1/1/2008 0:00 00 to 17 Female Some college, less than 4-yr degree 23 1/1/2008 0:00 18 to 64 Male No high school diploma 24 1/1/2008 0:00 18 to 64 Male No high school diploma 25 1/1/2008 0:00 18 to 64 Male No high school diploma 26 1/1/2008 18 to 6 ale No high school diploma 27 1/1/2008 0:00 18 to 64 Male No high school diploma 28 1/1/2008 0:00 18 to 64 Male No high school diploma 29 1/1/2008 0:00 18 to 64 Male No high school diploma capopeducationalattainment E Personal Income No Income No Income $5,000 to $9,999 $10,000 to $14,999 $15,000 to $24,999 $25,000 to $34,999 $35,000 to $49,999 No Income No Income $10,000 to $14,999 $15,000 to $24,999 No Income No Income No Income $5,000 to $9,999 $10,000 to $14,999 $15,000 to $24,999 No Income $5,000 to $9,999 No Income $5,000 to $9,999 No Income $5,000 to $9,999 $10,000 to $14,999 $15,000 to $24,999 $25,000 to $34,999 $35,000 to $49,999 $50,000 to $74,999 635274 33202 6857 2009 4711 7672 7598 1565 261172 163263 317119 7376 333713 222761 109200 popproj 19702050 - Excel File Home Insert Page Layout Formulas Data Review View Help Tell me what you want to do & Cut Calibri LUL = ab Wrap Text General Es Copy Paste BIU - A - Merge & Center - $ - %, . 00 0 Format Painter Conditional Forma Formatting - Table Clipboard Font Alignment Number 10 X fax A B D F H 1 fips E pop_female 0 pop_male 8533 1 8151 2 7753 3 8018 year age 1970 1970 1970 1970 1970 1970 1970 1970 1970 4 8551 - 5 9012 9637 : 6 G pop_total 8671 17204 8252 16403 8015 15768 8412 16430 8648 17199 9208 18220 9636 19273 9713 19274 10008 19656 10093 19811 10338 20072 9470 18940 9696 19329 9407 18859 9631 18828 7 9561 9648 8 1970 9 9718 9734 10 1 2 3 4 5 11 9470 9633 county 6001 ALAMEDA 6001 ALAMEDA 6001 ALAMEDA 6001 ALAMEDA 6001 ALAMEDA 6001 ALAMEDA 6001 ALAMEDA 6001 ALAMEDA 6001 ALAMEDA 6001 ALAMEDA 6001 ALAMEDA 6001 ALAMEDA 6001 ALAMEDA 6001 ALAMEDA 6001 ALAMEDA 6001 ALAMEDA 6001 ALAMEDA 6001 ALAMEDA 6001 ALAMEDA 6001 ALAMEDA 6001 ALAMEDA 6001 ALAMEDA 6001 ALAMEDA 6001 ALAMEDA 6001 ALAMEDA 6001 ALAMEDA 6001 ALAMEDA 6001 ALAMEDA 12 13 9452 9197 5 14 15 8994 9198 7 3 1970 1970 1970 1970 1970 1970 1970 1970 1970 1970 1970 1970 16 8827 9042 9 17 8863 9183 18 9226 9672 19 9918 11124 20 11514 14265 1 2 3 4 18192 17869 18046 18898 21042 25779 26274 26331 25288 19407 19046 18831 21 11611 14663 1970 11754 14577 22 23 1970 1970 11828 9304 24 5 6 7 8 25 9307 1970 1970 1970 13460 10103 9739 9863 9611 26 8968 9097 2 27 18708
Step by Step Solution
There are 3 Steps involved in it

Get step-by-step solutions from verified subject matter experts