

Question: using pandas in python. find the deadliest date (measured by highest number of new deaths). Find the date with the highest new cases. By how
using pandas in python. find the deadliest date (measured by highest number of new deaths). Find the date with the highest new cases. By how many days those two dates are apart from each other? I have posted a snippet of my code using pandas below. Why am I not getting the dates for Spain? what's wrong?
This is the data i am using to answer the question
| location | date | new_cases | new_deaths |
| Spain | 3/3/2020 | 45 | 1 |
| Spain | 3/4/2020 | 57 | 1 |
| Spain | 3/5/2020 | 37 | 1 |
| Spain | 3/6/2020 | 141 | 2 |
| Spain | 3/7/2020 | 100 | 5 |
| Spain | 3/8/2020 | 173 | 7 |
| Spain | 3/9/2020 | 400 | 11 |
| Spain | 3/10/2020 | 622 | 7 |
| Spain | 3/11/2020 | 582 | 19 |
| Spain | 3/12/2020 | 0 | 1 |
| Spain | 3/13/2020 | 2955 | 78 |
| Spain | 3/14/2020 | 1159 | 62 |
| Spain | 3/15/2020 | 1407 | 94 |
| Spain | 3/16/2020 | 2144 | 53 |
| Spain | 3/17/2020 | 1806 | 191 |
| Spain | 3/18/2020 | 2162 | 90 |
| Spain | 3/19/2020 | 4053 | 207 |
| Spain | 3/20/2020 | 2447 | 213 |
| Spain | 3/21/2020 | 4964 | 332 |
| Spain | 3/22/2020 | 3394 | 397 |
| Spain | 3/23/2020 | 6368 | 539 |
| Spain | 3/24/2020 | 4749 | 497 |
| Spain | 3/25/2020 | 9630 | 839 |
| Spain | 3/26/2020 | 8271 | 718 |
| Spain | 3/27/2020 | 7933 | 773 |
| Spain | 3/28/2020 | 7516 | 844 |
| Spain | 3/29/2020 | 6875 | 821 |
| Spain | 3/30/2020 | 7846 | 913 |
| Spain | 3/31/2020 | 7967 | 748 |
| Spain | 4/1/2020 | 8195 | 923 |
| Spain | 4/2/2020 | 7947 | 961 |
| Spain | 4/3/2020 | 7134 | 850 |
| Spain | 4/4/2020 | 6969 | 749 |
| Spain | 4/5/2020 | 5478 | 694 |
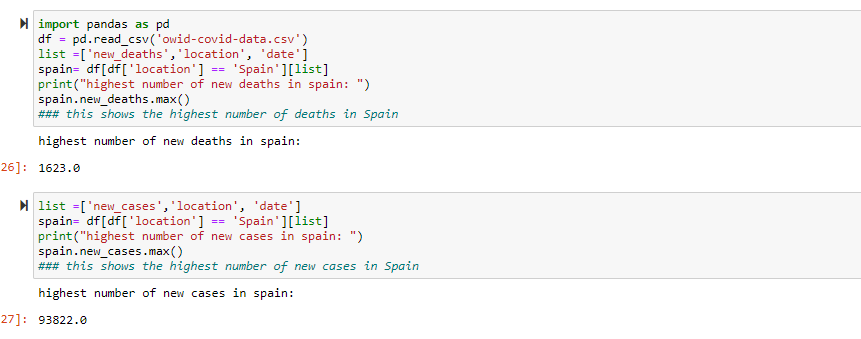
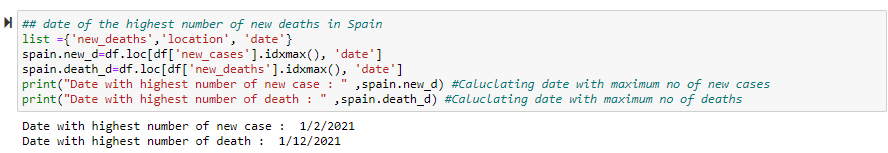
== Nimport pandas as pd df = pd.read_csv ('owid-covid-data.csv') list = ['new_deaths', 'location', 'date'] spain= df [df['location'] 'Spain'][list] print("highest number of new deaths in spain: ") spain.new_deaths.max ### this shows the highest number of deaths in Spain highest number of new deaths in spain: 26]: 1623.0 list = ['new_cases', 'location', 'date'] spain= df[df['location'] == 'Spain'][list] print("highest number of new cases in spain: ") spain.new_cases.max() ### this shows the highest number of new cases in Spain highest number of new cases in spain: 27]: 93822.0 ## date of the highest number of new deaths in Spain list = { 'new_deaths', 'location', 'date'} spain.new_d=df.loc[df['new_cases').idxmax(), 'date'] spain.death_d=df.loc[df['new_deaths').idxmax(), 'date'] print("Date with highest number of new case : ,spain.new_d) #Caluclating date with maximum no of new cases print("Date with highest number of death : , spain.death_d) #Caluclating date with maximum no of deaths Date with highest number of new case : 1/2/2021 Date with highest number of death : 1/12/2021 == Nimport pandas as pd df = pd.read_csv ('owid-covid-data.csv') list = ['new_deaths', 'location', 'date'] spain= df [df['location'] 'Spain'][list] print("highest number of new deaths in spain: ") spain.new_deaths.max ### this shows the highest number of deaths in Spain highest number of new deaths in spain: 26]: 1623.0 list = ['new_cases', 'location', 'date'] spain= df[df['location'] == 'Spain'][list] print("highest number of new cases in spain: ") spain.new_cases.max() ### this shows the highest number of new cases in Spain highest number of new cases in spain: 27]: 93822.0 ## date of the highest number of new deaths in Spain list = { 'new_deaths', 'location', 'date'} spain.new_d=df.loc[df['new_cases').idxmax(), 'date'] spain.death_d=df.loc[df['new_deaths').idxmax(), 'date'] print("Date with highest number of new case : ,spain.new_d) #Caluclating date with maximum no of new cases print("Date with highest number of death : , spain.death_d) #Caluclating date with maximum no of deaths Date with highest number of new case : 1/2/2021 Date with highest number of death : 1/12/2021
Step by Step Solution
There are 3 Steps involved in it

Get step-by-step solutions from verified subject matter experts