

Question: (using Pie chart and excel sheet): 1. What is the current value of mortgage loans outstanding? How has this value changed since 2017? 2. Calculate
(using Pie chart and excel sheet): 1. What is the current value of mortgage loans outstanding? How has this value changed since 2017? 2. Calculate the percentage of mortgage loans outstanding comprised of 1- to 4-family, multifamily residential, commercial, and farm.loans
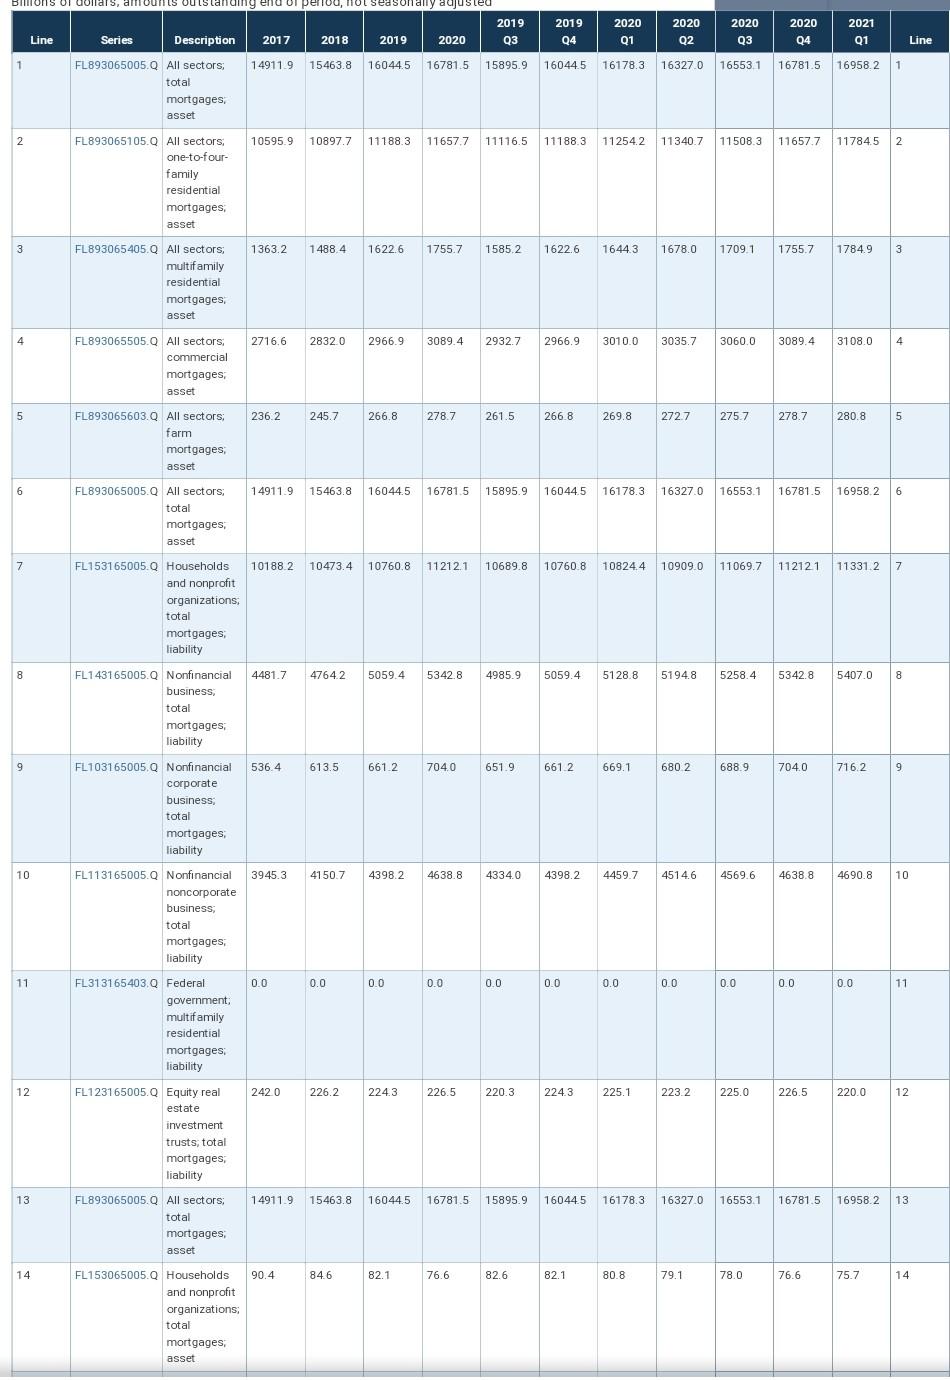
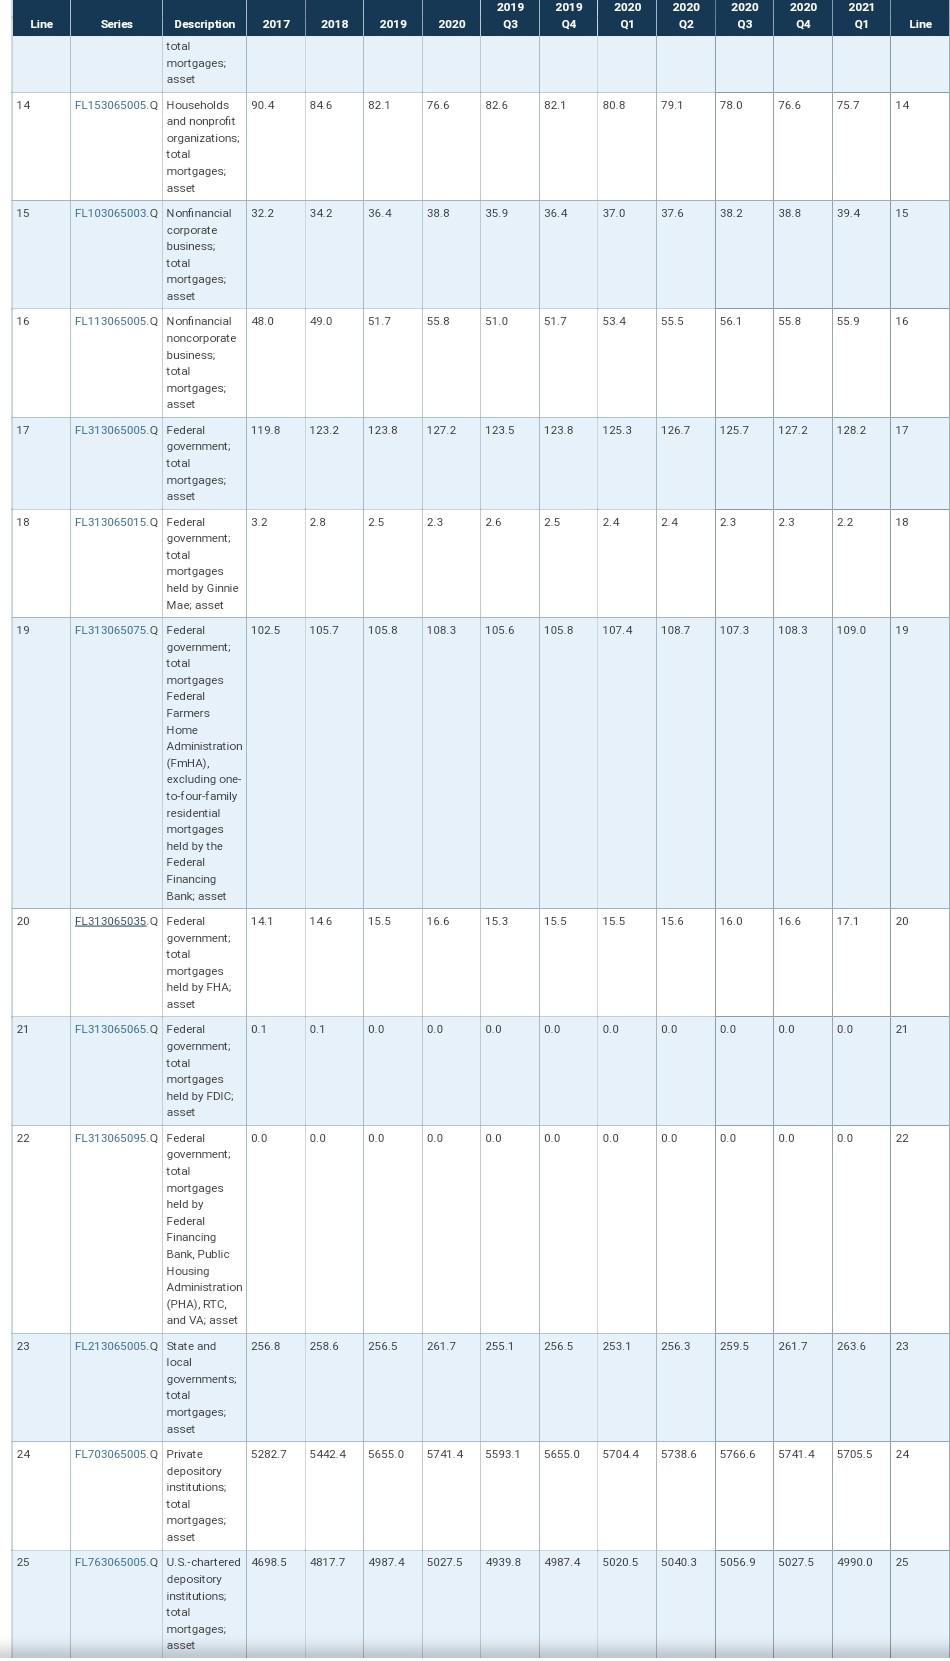
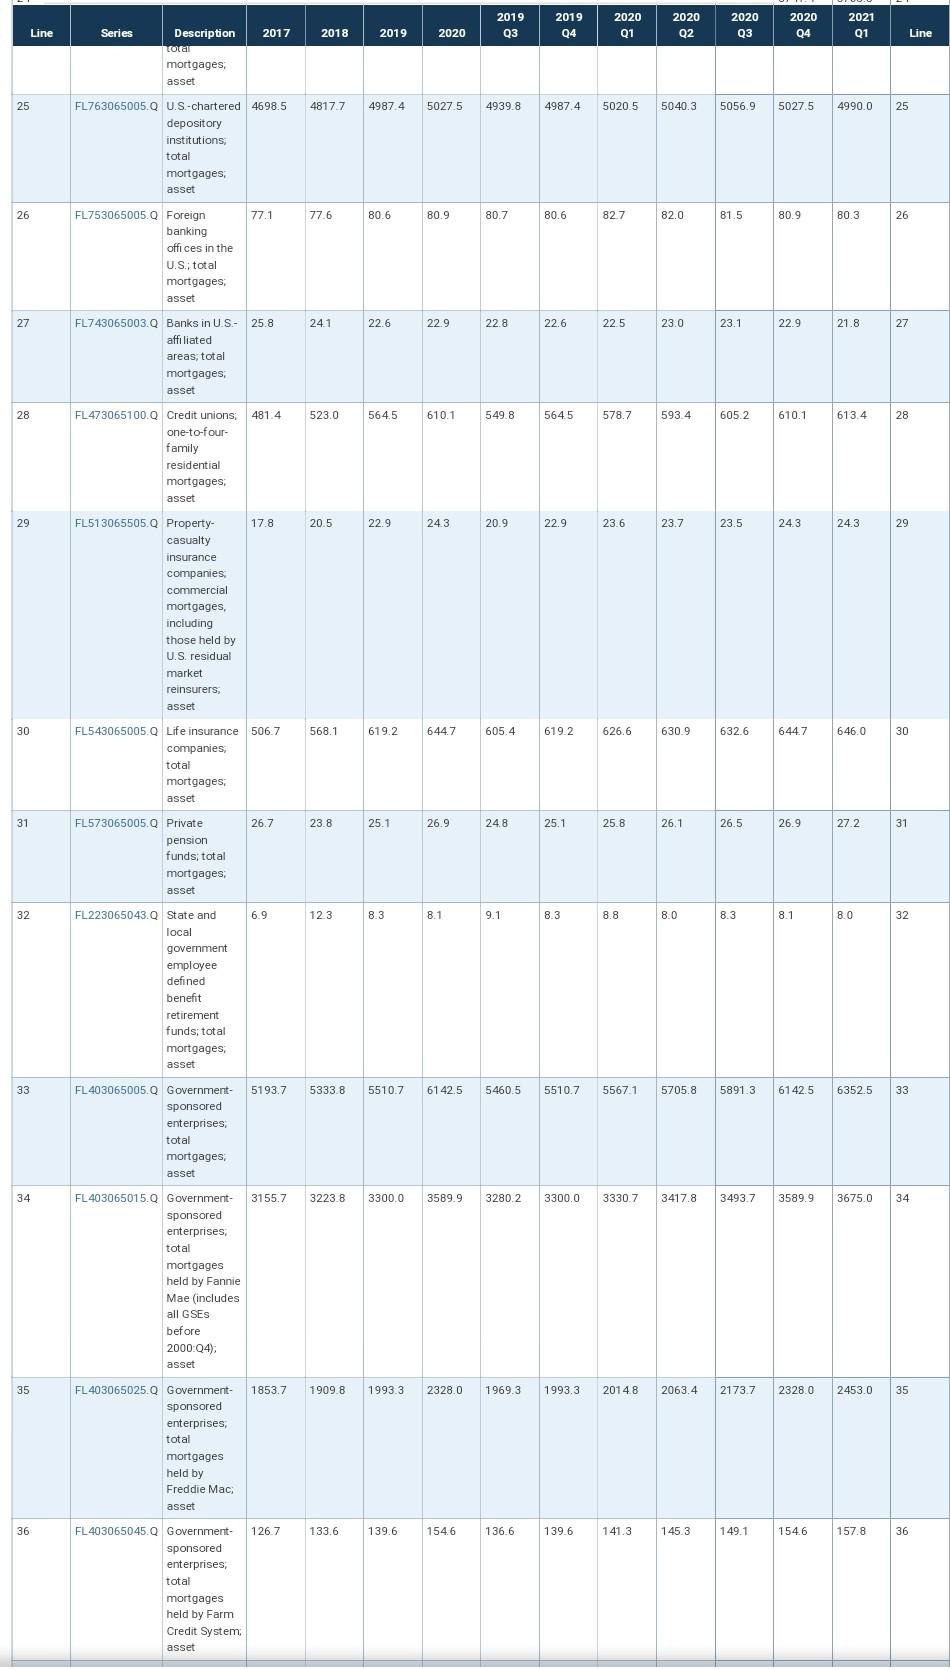
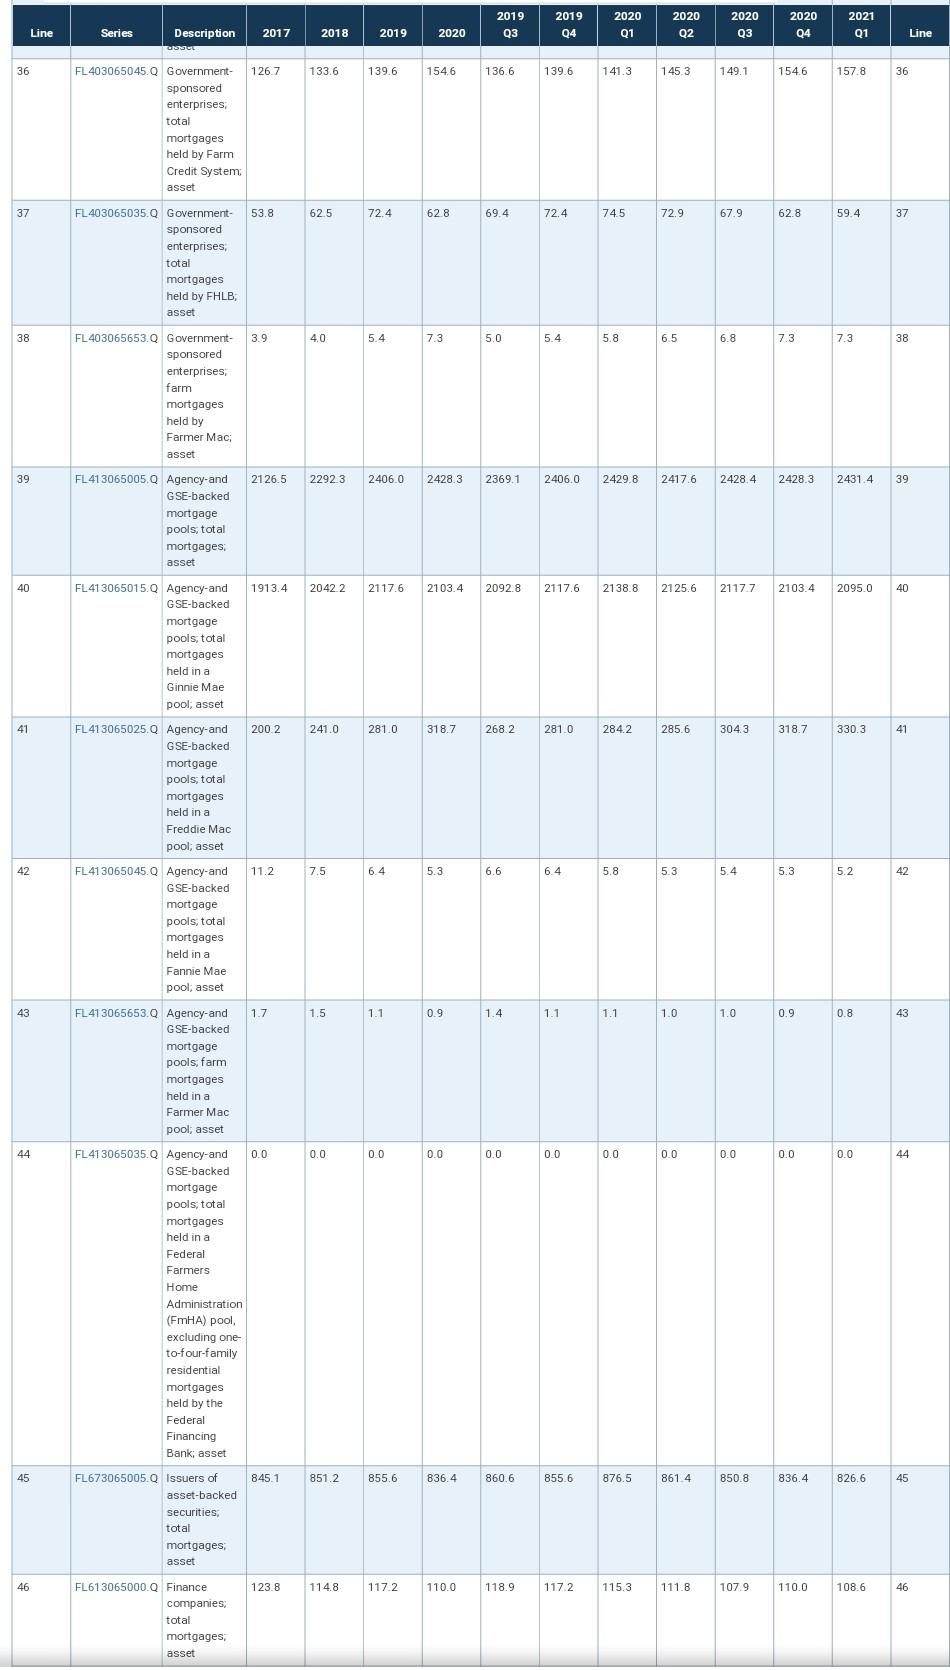
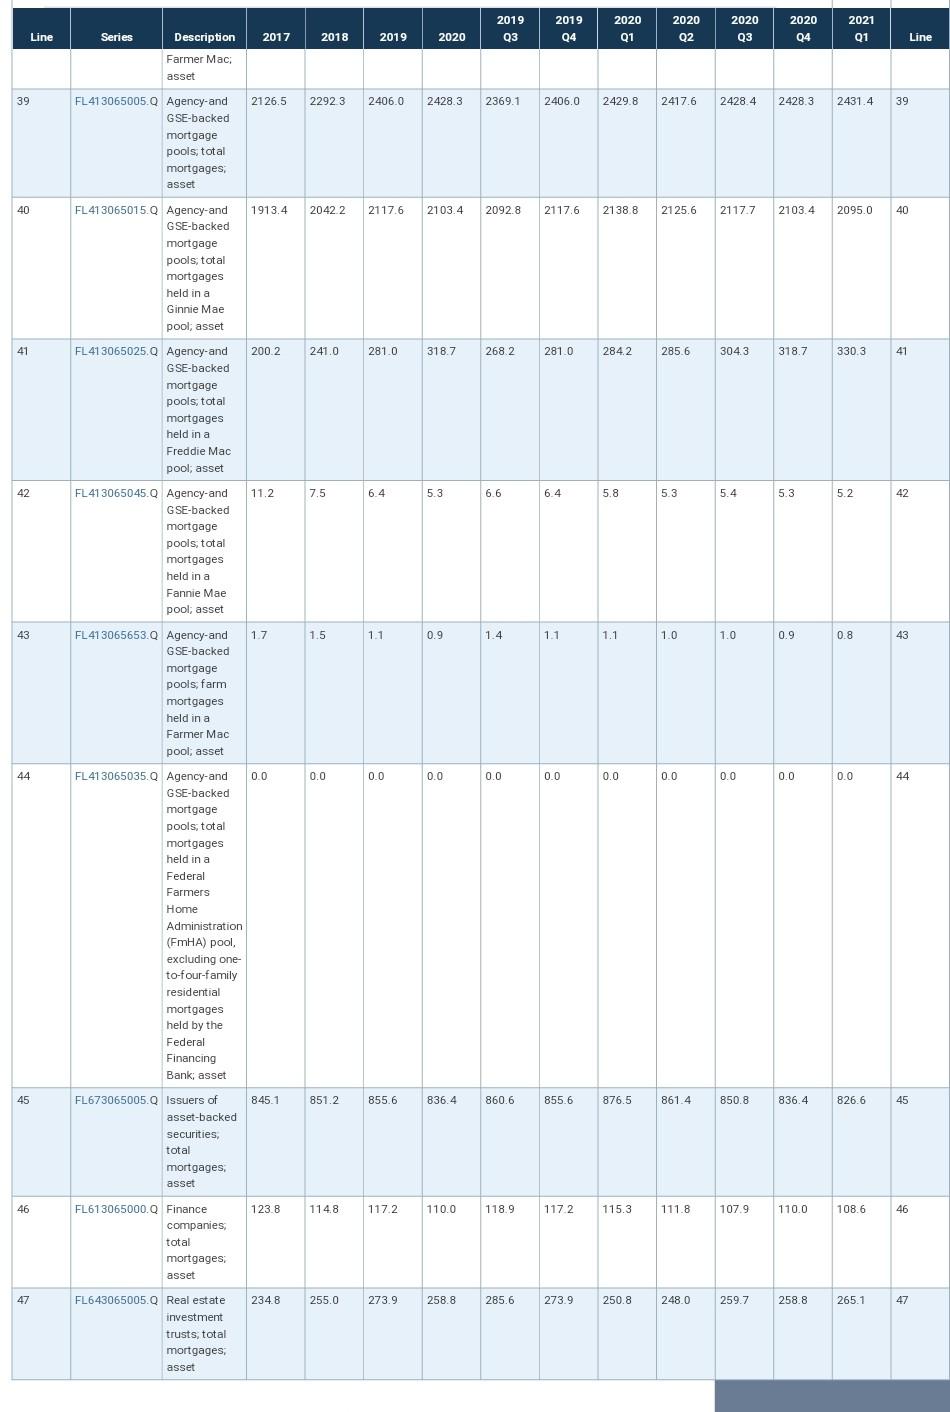
Q2 Line Bhons of dollars, amounts outstandin eru i period, hot seasonally adjusted 2019 2019 2020 2020 2020 2020 2021 Line Series Description 2017 2018 2019 2020 Q3 04 Q1 Q3 04 01 FL893065005.Q All sectors, 14911.9 15463.8 16044.5 167815 15895.9 160445 16178.3 163270 165531 16781.5 169582 1 total mortgages asset 2 FL893065105.0 All sectors, 10595.9 10897.7 11188.3 11657.7 11116.5 11188.3 11254.2 11340.7 115083 11657.7 11784.5 2 one-to-four- family residential mortgages asset 3 1363.2 1488.4 1622.6 6226 1755.7 15852 1622.6 1644.3 16445 1678.0 1709.1 1755.7 1784.9 3 FL893065405. All sectors, multifamily residential mortgages asset 4 2716.6 28320 28320 1966.9 2966.9 3089.4 2932.7 2966.9 3010.0 3035.7 3060.0 3089.4 3108.0 4 FL893065505.0 All sectors, commercial mortgages asset 5 236.2 245.7 266.8 278.7 278.7 261.5 266.8 269.8 2727 272.7 275.7 278.7 280.8 5 FL893065603. All sectors; farm mortgages asset 6 14911.9 49119 15463.8 16044.5 16781.5 15895.9 16044.5 16178.3 16327.0 16553.1 16781.5 16958.2 6 FL893065005. All sectors, total mortgages asset 7 101882 10473.4 10760.8 11212.1 10689.8 10760 8 10824.4 10909.0 11069.7 112121 11331 2 7 FL153165005. Households and nonprofit organizations total mortgages liability 8 4481.7 47642 5059.4 5342.8 4985.9 5059.4 5128.8 5194.8 5258.4 5342.8 5407.0 8 FL143165005. Nonfinancial business total mortgages liability 9 536.4 536.4 613.5 513:5 6612 661.2 704.0 651.9 6612 669.1 6802 688.9 704.0 716.2 9 FL103165005. Nonfinancial , corporate business: total mortgages liability 10 3945.3 3945.3 4150.7 4398.2 4638.8 43340 4398.2 44597 4459.7 4514.6 4569.6 4638.8 4690.8 10 FL113165005.0 Nonfinancial noncorporate business, total mortgages liability 11 0.0 0.0 0.0 0.0 0.0 0.0 0.0 0.0 0.0 0.0 0.0 11 FL 313165403.Q Federal government multifamily residential mortgages: liability 12 2420 226.2 224.3 224.3 226.5 220.3 2243 224.3 225.1 223.2 225.0 225.0 226.5 220.0 12 FL123165005. Equity real estate investment trusts, total , mortgages liability 13 14911.9 15463.8 16044.5 16781.5 15895.9 160445 16178.3 16327 0 165531 16781.5 16958.2 13 FL893065005.Q All sectors; total mortgages asset 14 90.4 90.4 84.6 82.1 76.6 82.6 82.1 80.8 79.1 78.0 76.6 75.7 14 FL153065005.Q Households and nonprofit organizations total mortgages: asset 2019 Q3 2019 Q4 2020 Q1 2020 Q2 2020 Q3 2020 Q4 2021 Q1 Line Series 2017 2018 2019 2020 Line Description total mortgages, asset 14 90.4 84.6 82.1 76.6 82.6 82.1 80.8 79.1 78.0 76.6 75.7 14 FL153065005.Q Households and nonprofit organizations; total mortgages asset 15 32.2 342 36.4 38.8 35.9 36.4 37.0 37.6 38.2 38.8 39.4 15 FL103065003.Q Nonfinancial corporate business, total mortgages asset 16 48.0 49.0 51.7 55.8 51.0 51.7 53.4 55.5 56.1 55.8 55.9 16 FL113065005. Nonfinancial noncorporate business, total mortgages asset 17 119.8 123.2 1236 123.8 127.2 123.5 123.8 125.3 126.7 125.7 127.2 127.2 128.2 17 FL313065005.Q Federal government total mortgages asset 18 3.2 2.8 2.5 2.3 2.6 2.5 2.4 24 2.3 2.3 2.2 18 FL313065015.Q Federal government total mortgages held by Ginnie Mae; asset 19 102.5 105.7 105.8 108.3 105.6 105.8 107.4 108.7 107.3 107.3 108.3 109.0 19 FL313065075. Federal government, total mortgages Federal Farmers Home Administration (FMHA). excluding one to-four-family residential mortgages held by the Federal Financing Bank, asset 20 14.1 146 15.5 16.6 15.3 15.5 15.5 15.6 16.0 16.0 16.6 17.1 20 FL313065035 Q Federal government total mortgages held by FHA asset 21 0.1 0.1 0.0 0.0 0.0 0.0 0.0 0.0 0.0 0.0 0.0 21 FL313065065.Q Federal government total mortgages held by FDIC, asset 22 0.0 0.0 0.0 0.0 0.0 0.0 0.0 0.0 0.0 0.0 0.0 22 FL313065095. Federal government total mortgages held by Federal Financing Bank, Public Housing Adn istration (PHA), RTC, and VA, asset 23 256.8 258.6 256.5 256.5 261.7 255.1 256.5 256.5 253.1 256.3 259.5 261.7 263.6 23 FL213065005. State and local governments, total mortgages asset 24 5282.7 5442 4 5655.0 5741.4 57414 5593.1 5655.0 57044 57044 5738.6 5766.6 5741.4 5705.5 24 FL703065005. Private depository institutions, total mortgages asset 25 4817.7 1817.7 4987.4 5027.5 4939.8 4987.4 5020.5 5040.3 5056.9 5027.5 4990.0 25 FL763065005.0 U.S.-chartered 4698.5 depository institutions, total mortgages asset 2019 2019 Q3 2020 Q1 2020 02 2020 Q3 2020 Q4 Line Series 2017 2021 Q1 2018 2019 2020 Q4 Line Description Total mortgages asset 25 4817.7 49874 5027.5 4939.8 4987.4 5020.5 5040.3 5056.9 5027.5 4990.0 25 FL763065005.Q U.S.-chartered 4698.5 depository institutions total mortgages asset 26 77.1 77.6 80.6 80.9 80.7 80.6 82.7 82.0 82.0 81.5 80.9 80.3 26 FL753065005.Q Foreign banking offices in the U.S., total mortgages: asset 27 25.8 24.1 22.6 22.9 22.8 22.6 22.5 23.0 23.1 22.9 21.8 27 FL743065003. Banks in U.S.- affiliated areas, total mortgages asset 28 481.4 523.0 564.5 610.1 549.8 564.5 578.7 593.4 6052 605.2 610.1 613.4 28 FL473065100.0 Credit unions one-to-four- family residential mortgages asset 29 17.8 20.5 22.9 24.3 20.9 22.9 23.6 23.7 23.5 24.3 24.3 29 merr FL513065505.Q Property- casualty insurance companies commercial mortgages including those held by U.S. residual market reinsurers, asset 30 506.7 568.1 6192 619.2 6447 605.4 619 2 626.6 630.9 632.6 632.6 644.7 646.0 30 FL543065005. Life insurance companies, total mortgages asset 31 26.7 23.8 25.1 26.9 24.8 25.1 25.8 26.1 26.5 26.9 27.2 31 FL573065005.Q Private pension funds; total mortgages asset 32 6.9 12.3 8.3 8.1 9.1 8.3 8.8 8.0 8.3 8.1 8.0 32 FL223065043. State and local government employee defined benefit retirement funds; total mortgages asset 33 5193.7 5333.8 5510.7 5107 61 42.5 5460.5 5460.5 5510.7 55671 5510.7 5567.1 57058 5891.3 8913 6142.5 6352.5 63523 33 FL403065005. Government- sponsored enterprises, total mortgages asset 34 3155.7 3223.8 3300.0 300.0 35899 3280.2 33000 3330.7 3417.8 3417.8 3493.7 3589.9 3675.0 34 FL 403065015.Q Government- sponsored enterprises, total mortgages held by Fannie Mae (includes all GSES before 200004); asset FL 403065025. Government- sponsored enterprises, total mortgages held by Freddie Mac: asset 35 1853.7 1909.8 1993.3 9933 2328.0 1969.3 1993.3 2014 8 2063.4 2063.4 2173.7 21737 23280 2453.0 35 36 126.7 133.6 139.6 154.6 136.6 139.6 141.3 145.3 149.1 154.6 157.8 36 FL 403065045. Government- sponsored enterprises, total mortgages held by Farm Credit System asset 2019 2019 2020 Q1 2020 Q2 2020 2020 04 2021 01 Line Series 2017 2018 2019 2020 23 Q4 Q3 Line 36 126.7 133.6 139.6 154.6 136.6 139.6 141.3 145.3 149.1 154.6 157.8 36 Description ISSU FL 403065045.0 Government- sponsored enterprises, total mortgages held by Farm Credit System asset 37 53.8 62.5 72.4 62.8 69.4 72.4 74.5 72.9 67.9 62.8 59.4 37 FL403065035.Q Government- sponsored enterprises, total mortgages held by FHLB asset 38 3.9 40 5.4 7.3 5.0 5.4 5.8 6.5 6.8 7.3 7.3 38 FL 403065653.Q Government- sponsored enterprises, farm mortgages held by Farmer Mac; asset 39 2126,5 22923 2406.0 2428.3 24283 2369.1 2406.0 2429.8 2417.6 2428.4 2428.3 2431.4 39 FL 413065005. Agency-and GSE-backed mortgage pools, total mortgages: asset 40 1913.4 2042 2 0422 2117.6 2103.4 2092.8 2117.6 2117.6 2138.8 2125.6 2117.7 2103.4 2095.0 40 FL413065015. Agency-and GSE-backed mortgage pools, total mortgages held in a Ginnie Mae poolasset 41 2002 241.0 281.0 318.7 2682 281.0 2842 285.6 304.3 318.7 330.3 41 FL 413065025.Q Agency-and GSE-backed mortgage pools, total mortgages held in a Freddie Mac pool, asset 42 11.2 7.5 6.4 5.3 6.6 6.4 5.8 5.3 5.4 5.3 5.2 42 FL 413065045. Agency and GSE-backed mortgage pools, total mortgages held in a Fannie Mae pool, asset 43 1.7 1.5 1.1 0.9 1.4 1.1 1.1 1.0 1.0 0.9 0.8 43 FL413065653.Q Agency-and GSE-backed mortgage pools, farm mortgages held in a Farmer Mac pool, asset FL 413065035.Q Agency-and GSE-backed mortgage pools, total 44 0.0 0.0 0.0 0.0 0.0 0.0 0.0 0.0 0.0 0.0 0.0 44 mortgages held in a Federal Farmers Home Administration (FmHA) pool, excluding one to-four-family residential mortgages held by the Federa Financing Bank; asset 45 845.1 851.2 855.6 836.4 860.6 855.6 855.6 876.5 861.4 8508 850.8 836.4 826,6 45 FL673065005.Q Issuers of asset-backed securities, total mortgages asset 46 123.8 114.8 117.2 117.2 110.0 118.9 117.2 117.2 115.3 111.8 107.9 107.9 110.0 108.6 46 FL613065000.Q Finance companies total mortgages asset 2019 Q3 2019 Q4 2020 Q1 2020 Q2 2020 03 2020 04 2021 Q1 Line Series 2017 2018 2019 2020 Line Description Farmer Mac; asset 39 2126.5 22923 2406.0 24283 2369.1 2406,0 2429.8 2417.6 2428.4 2428.3 2431.4 39 FL413065005.Q Agency and GSE-backed mortgage pools, total mortgages asset 40 1913.4 20422 21176 2117.6 2103.4 2092.8 2117.6 2138.8 2125.6 2117.7 2103.4 2095.0 40 41 2002 241.0 281.0 318.7 268.2 281.0 2842 285.6 304.3 318.7 330.3 41 FL413065015.Q Agency-and GSE-backed mortgage pools, total mortgages held in a Ginnie Mae pool; asset ; FL413065025 Q Agency-and G SE-backed mortgage pools, total mortgages held in a Freddie Mac pool; asset FL413065045.0 Agency-and GSE-backed mortgage pools, total mortgages held in a Fannie Mae pool; asset 42 7.5 11.2 6.4 5.3 6.6 6.6 6.4 5.8 5.3 5.3 5.4 5.4 5.3 5.2 42 14 43 1.7 1.5 1.1 0.9 1.4 1.1 11 1.1 1.0 1.0 0.9 0.8 43 FL 413065653.Q Agency-and GSE-backed mortgage pools, farm mortgages held in a Farmer Mac pool, asset 44 0.0 0.0 0.0 0.0 0.0 0.0 0.0 0.0 0.0 0.0 0.0 0.0 44 FL 413065035.Q Agency-and GSE-backed mortgage pools total mortgages held in a Federal Farmers Home Administration (FmHA) pool, excluding one to-four-family residential mortgages held by the Federal Financing Bank; asset 45 845.1 851.2 351.2 855.6 836.4 860.6 855.6 876.5 861.4 861.4 850.8 836.4 826.6 45 FL673065005.0 Issuers of asset-backed securities, total mortgages asset 46 123.8 1148 114.8 117.2 110.0 118.9 117.2 115.3 111.8 111.8 107.9 107.9 110.0 108.6 46 FL613065000. Finance companies total mortgages asset 47 234.8 255.0 273.9 258.8 285.6 273.9 250.8 248.0 259.7 258.8 265.1 47 FL643065005. Real estate investment trusts, total mortgages asset Q2 Line Bhons of dollars, amounts outstandin eru i period, hot seasonally adjusted 2019 2019 2020 2020 2020 2020 2021 Line Series Description 2017 2018 2019 2020 Q3 04 Q1 Q3 04 01 FL893065005.Q All sectors, 14911.9 15463.8 16044.5 167815 15895.9 160445 16178.3 163270 165531 16781.5 169582 1 total mortgages asset 2 FL893065105.0 All sectors, 10595.9 10897.7 11188.3 11657.7 11116.5 11188.3 11254.2 11340.7 115083 11657.7 11784.5 2 one-to-four- family residential mortgages asset 3 1363.2 1488.4 1622.6 6226 1755.7 15852 1622.6 1644.3 16445 1678.0 1709.1 1755.7 1784.9 3 FL893065405. All sectors, multifamily residential mortgages asset 4 2716.6 28320 28320 1966.9 2966.9 3089.4 2932.7 2966.9 3010.0 3035.7 3060.0 3089.4 3108.0 4 FL893065505.0 All sectors, commercial mortgages asset 5 236.2 245.7 266.8 278.7 278.7 261.5 266.8 269.8 2727 272.7 275.7 278.7 280.8 5 FL893065603. All sectors; farm mortgages asset 6 14911.9 49119 15463.8 16044.5 16781.5 15895.9 16044.5 16178.3 16327.0 16553.1 16781.5 16958.2 6 FL893065005. All sectors, total mortgages asset 7 101882 10473.4 10760.8 11212.1 10689.8 10760 8 10824.4 10909.0 11069.7 112121 11331 2 7 FL153165005. Households and nonprofit organizations total mortgages liability 8 4481.7 47642 5059.4 5342.8 4985.9 5059.4 5128.8 5194.8 5258.4 5342.8 5407.0 8 FL143165005. Nonfinancial business total mortgages liability 9 536.4 536.4 613.5 513:5 6612 661.2 704.0 651.9 6612 669.1 6802 688.9 704.0 716.2 9 FL103165005. Nonfinancial , corporate business: total mortgages liability 10 3945.3 3945.3 4150.7 4398.2 4638.8 43340 4398.2 44597 4459.7 4514.6 4569.6 4638.8 4690.8 10 FL113165005.0 Nonfinancial noncorporate business, total mortgages liability 11 0.0 0.0 0.0 0.0 0.0 0.0 0.0 0.0 0.0 0.0 0.0 11 FL 313165403.Q Federal government multifamily residential mortgages: liability 12 2420 226.2 224.3 224.3 226.5 220.3 2243 224.3 225.1 223.2 225.0 225.0 226.5 220.0 12 FL123165005. Equity real estate investment trusts, total , mortgages liability 13 14911.9 15463.8 16044.5 16781.5 15895.9 160445 16178.3 16327 0 165531 16781.5 16958.2 13 FL893065005.Q All sectors; total mortgages asset 14 90.4 90.4 84.6 82.1 76.6 82.6 82.1 80.8 79.1 78.0 76.6 75.7 14 FL153065005.Q Households and nonprofit organizations total mortgages: asset 2019 Q3 2019 Q4 2020 Q1 2020 Q2 2020 Q3 2020 Q4 2021 Q1 Line Series 2017 2018 2019 2020 Line Description total mortgages, asset 14 90.4 84.6 82.1 76.6 82.6 82.1 80.8 79.1 78.0 76.6 75.7 14 FL153065005.Q Households and nonprofit organizations; total mortgages asset 15 32.2 342 36.4 38.8 35.9 36.4 37.0 37.6 38.2 38.8 39.4 15 FL103065003.Q Nonfinancial corporate business, total mortgages asset 16 48.0 49.0 51.7 55.8 51.0 51.7 53.4 55.5 56.1 55.8 55.9 16 FL113065005. Nonfinancial noncorporate business, total mortgages asset 17 119.8 123.2 1236 123.8 127.2 123.5 123.8 125.3 126.7 125.7 127.2 127.2 128.2 17 FL313065005.Q Federal government total mortgages asset 18 3.2 2.8 2.5 2.3 2.6 2.5 2.4 24 2.3 2.3 2.2 18 FL313065015.Q Federal government total mortgages held by Ginnie Mae; asset 19 102.5 105.7 105.8 108.3 105.6 105.8 107.4 108.7 107.3 107.3 108.3 109.0 19 FL313065075. Federal government, total mortgages Federal Farmers Home Administration (FMHA). excluding one to-four-family residential mortgages held by the Federal Financing Bank, asset 20 14.1 146 15.5 16.6 15.3 15.5 15.5 15.6 16.0 16.0 16.6 17.1 20 FL313065035 Q Federal government total mortgages held by FHA asset 21 0.1 0.1 0.0 0.0 0.0 0.0 0.0 0.0 0.0 0.0 0.0 21 FL313065065.Q Federal government total mortgages held by FDIC, asset 22 0.0 0.0 0.0 0.0 0.0 0.0 0.0 0.0 0.0 0.0 0.0 22 FL313065095. Federal government total mortgages held by Federal Financing Bank, Public Housing Adn istration (PHA), RTC, and VA, asset 23 256.8 258.6 256.5 256.5 261.7 255.1 256.5 256.5 253.1 256.3 259.5 261.7 263.6 23 FL213065005. State and local governments, total mortgages asset 24 5282.7 5442 4 5655.0 5741.4 57414 5593.1 5655.0 57044 57044 5738.6 5766.6 5741.4 5705.5 24 FL703065005. Private depository institutions, total mortgages asset 25 4817.7 1817.7 4987.4 5027.5 4939.8 4987.4 5020.5 5040.3 5056.9 5027.5 4990.0 25 FL763065005.0 U.S.-chartered 4698.5 depository institutions, total mortgages asset 2019 2019 Q3 2020 Q1 2020 02 2020 Q3 2020 Q4 Line Series 2017 2021 Q1 2018 2019 2020 Q4 Line Description Total mortgages asset 25 4817.7 49874 5027.5 4939.8 4987.4 5020.5 5040.3 5056.9 5027.5 4990.0 25 FL763065005.Q U.S.-chartered 4698.5 depository institutions total mortgages asset 26 77.1 77.6 80.6 80.9 80.7 80.6 82.7 82.0 82.0 81.5 80.9 80.3 26 FL753065005.Q Foreign banking offices in the U.S., total mortgages: asset 27 25.8 24.1 22.6 22.9 22.8 22.6 22.5 23.0 23.1 22.9 21.8 27 FL743065003. Banks in U.S.- affiliated areas, total mortgages asset 28 481.4 523.0 564.5 610.1 549.8 564.5 578.7 593.4 6052 605.2 610.1 613.4 28 FL473065100.0 Credit unions one-to-four- family residential mortgages asset 29 17.8 20.5 22.9 24.3 20.9 22.9 23.6 23.7 23.5 24.3 24.3 29 merr FL513065505.Q Property- casualty insurance companies commercial mortgages including those held by U.S. residual market reinsurers, asset 30 506.7 568.1 6192 619.2 6447 605.4 619 2 626.6 630.9 632.6 632.6 644.7 646.0 30 FL543065005. Life insurance companies, total mortgages asset 31 26.7 23.8 25.1 26.9 24.8 25.1 25.8 26.1 26.5 26.9 27.2 31 FL573065005.Q Private pension funds; total mortgages asset 32 6.9 12.3 8.3 8.1 9.1 8.3 8.8 8.0 8.3 8.1 8.0 32 FL223065043. State and local government employee defined benefit retirement funds; total mortgages asset 33 5193.7 5333.8 5510.7 5107 61 42.5 5460.5 5460.5 5510.7 55671 5510.7 5567.1 57058 5891.3 8913 6142.5 6352.5 63523 33 FL403065005. Government- sponsored enterprises, total mortgages asset 34 3155.7 3223.8 3300.0 300.0 35899 3280.2 33000 3330.7 3417.8 3417.8 3493.7 3589.9 3675.0 34 FL 403065015.Q Government- sponsored enterprises, total mortgages held by Fannie Mae (includes all GSES before 200004); asset FL 403065025. Government- sponsored enterprises, total mortgages held by Freddie Mac: asset 35 1853.7 1909.8 1993.3 9933 2328.0 1969.3 1993.3 2014 8 2063.4 2063.4 2173.7 21737 23280 2453.0 35 36 126.7 133.6 139.6 154.6 136.6 139.6 141.3 145.3 149.1 154.6 157.8 36 FL 403065045. Government- sponsored enterprises, total mortgages held by Farm Credit System asset 2019 2019 2020 Q1 2020 Q2 2020 2020 04 2021 01 Line Series 2017 2018 2019 2020 23 Q4 Q3 Line 36 126.7 133.6 139.6 154.6 136.6 139.6 141.3 145.3 149.1 154.6 157.8 36 Description ISSU FL 403065045.0 Government- sponsored enterprises, total mortgages held by Farm Credit System asset 37 53.8 62.5 72.4 62.8 69.4 72.4 74.5 72.9 67.9 62.8 59.4 37 FL403065035.Q Government- sponsored enterprises, total mortgages held by FHLB asset 38 3.9 40 5.4 7.3 5.0 5.4 5.8 6.5 6.8 7.3 7.3 38 FL 403065653.Q Government- sponsored enterprises, farm mortgages held by Farmer Mac; asset 39 2126,5 22923 2406.0 2428.3 24283 2369.1 2406.0 2429.8 2417.6 2428.4 2428.3 2431.4 39 FL 413065005. Agency-and GSE-backed mortgage pools, total mortgages: asset 40 1913.4 2042 2 0422 2117.6 2103.4 2092.8 2117.6 2117.6 2138.8 2125.6 2117.7 2103.4 2095.0 40 FL413065015. Agency-and GSE-backed mortgage pools, total mortgages held in a Ginnie Mae poolasset 41 2002 241.0 281.0 318.7 2682 281.0 2842 285.6 304.3 318.7 330.3 41 FL 413065025.Q Agency-and GSE-backed mortgage pools, total mortgages held in a Freddie Mac pool, asset 42 11.2 7.5 6.4 5.3 6.6 6.4 5.8 5.3 5.4 5.3 5.2 42 FL 413065045. Agency and GSE-backed mortgage pools, total mortgages held in a Fannie Mae pool, asset 43 1.7 1.5 1.1 0.9 1.4 1.1 1.1 1.0 1.0 0.9 0.8 43 FL413065653.Q Agency-and GSE-backed mortgage pools, farm mortgages held in a Farmer Mac pool, asset FL 413065035.Q Agency-and GSE-backed mortgage pools, total 44 0.0 0.0 0.0 0.0 0.0 0.0 0.0 0.0 0.0 0.0 0.0 44 mortgages held in a Federal Farmers Home Administration (FmHA) pool, excluding one to-four-family residential mortgages held by the Federa Financing Bank; asset 45 845.1 851.2 855.6 836.4 860.6 855.6 855.6 876.5 861.4 8508 850.8 836.4 826,6 45 FL673065005.Q Issuers of asset-backed securities, total mortgages asset 46 123.8 114.8 117.2 117.2 110.0 118.9 117.2 117.2 115.3 111.8 107.9 107.9 110.0 108.6 46 FL613065000.Q Finance companies total mortgages asset 2019 Q3 2019 Q4 2020 Q1 2020 Q2 2020 03 2020 04 2021 Q1 Line Series 2017 2018 2019 2020 Line Description Farmer Mac; asset 39 2126.5 22923 2406.0 24283 2369.1 2406,0 2429.8 2417.6 2428.4 2428.3 2431.4 39 FL413065005.Q Agency and GSE-backed mortgage pools, total mortgages asset 40 1913.4 20422 21176 2117.6 2103.4 2092.8 2117.6 2138.8 2125.6 2117.7 2103.4 2095.0 40 41 2002 241.0 281.0 318.7 268.2 281.0 2842 285.6 304.3 318.7 330.3 41 FL413065015.Q Agency-and GSE-backed mortgage pools, total mortgages held in a Ginnie Mae pool; asset ; FL413065025 Q Agency-and G SE-backed mortgage pools, total mortgages held in a Freddie Mac pool; asset FL413065045.0 Agency-and GSE-backed mortgage pools, total mortgages held in a Fannie Mae pool; asset 42 7.5 11.2 6.4 5.3 6.6 6.6 6.4 5.8 5.3 5.3 5.4 5.4 5.3 5.2 42 14 43 1.7 1.5 1.1 0.9 1.4 1.1 11 1.1 1.0 1.0 0.9 0.8 43 FL 413065653.Q Agency-and GSE-backed mortgage pools, farm mortgages held in a Farmer Mac pool, asset 44 0.0 0.0 0.0 0.0 0.0 0.0 0.0 0.0 0.0 0.0 0.0 0.0 44 FL 413065035.Q Agency-and GSE-backed mortgage pools total mortgages held in a Federal Farmers Home Administration (FmHA) pool, excluding one to-four-family residential mortgages held by the Federal Financing Bank; asset 45 845.1 851.2 351.2 855.6 836.4 860.6 855.6 876.5 861.4 861.4 850.8 836.4 826.6 45 FL673065005.0 Issuers of asset-backed securities, total mortgages asset 46 123.8 1148 114.8 117.2 110.0 118.9 117.2 115.3 111.8 111.8 107.9 107.9 110.0 108.6 46 FL613065000. Finance companies total mortgages asset 47 234.8 255.0 273.9 258.8 285.6 273.9 250.8 248.0 259.7 258.8 265.1 47 FL643065005. Real estate investment trusts, total mortgages asset
Step by Step Solution
There are 3 Steps involved in it

Get step-by-step solutions from verified subject matter experts