

Question: Using Python 3: Write a Python program that draws a pie chart of the n most frequent letters in Words.txt file. The program will: a.
Using Python 3:
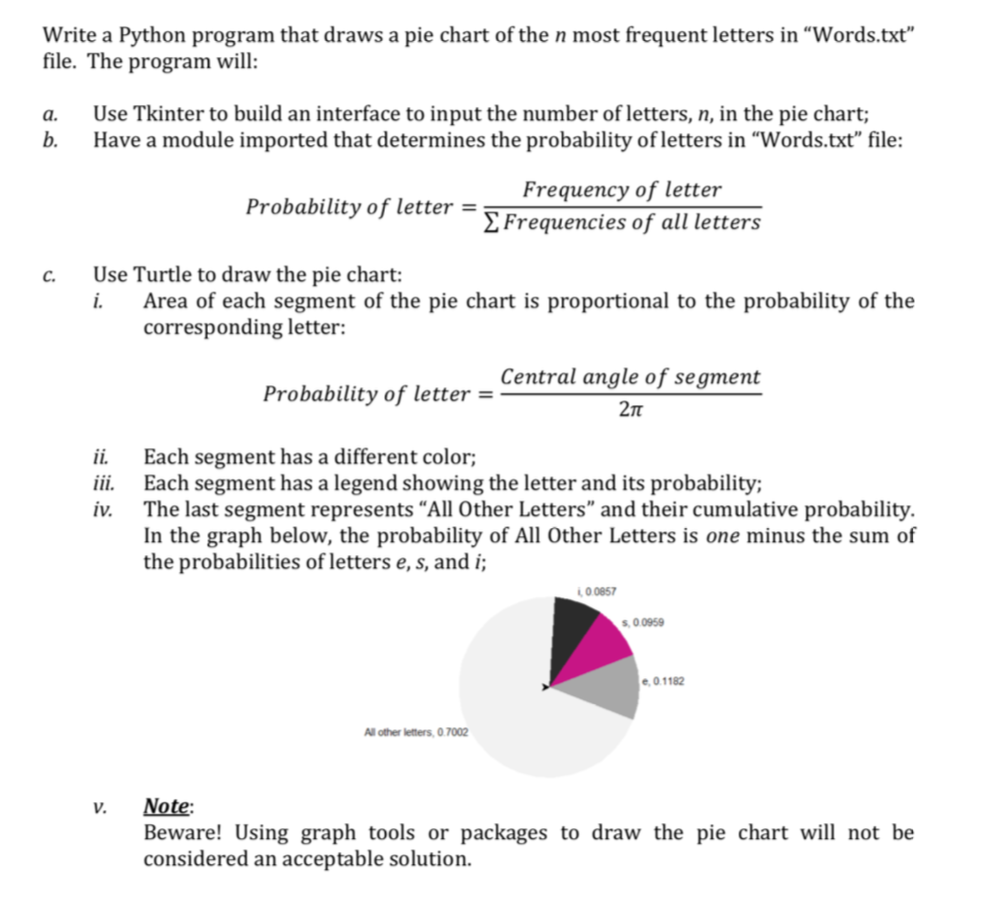
Write a Python program that draws a pie chart of the n most frequent letters in "Words.txt" file. The program will: a. Use Tkinter to build an interface to input the number of letters, n, in the pie chart; b. Have a module imported that determines the probability of letters in "Words.txt" file: Frequency of letter ? Frequencies of all letters Probability of letter- c. Use Turtle to draw the pie chart: i. Area of each segment of the pie chart is proportional to the probability of the corresponding letter Central angle of segment 2T Probability of letter- ii. Each segment has a different color; iii. Each segment has a legend showing the letter and its probability iv. The last segment represents "All Other Letters" and their cumulative probability. In the graph below, the probability of All Other Letters is one minus the sum of the probabilities of letters e, s, and i; L0 0857 s, 0 0959 e0.1182 All other letters, 0.7002 v. Note: Beware! Using graph tools or packages to draw the pie chart wil not be considered an acceptable solution
Step by Step Solution
There are 3 Steps involved in it

Get step-by-step solutions from verified subject matter experts