

Question: Using Python code, create a line chart ( s ) with a trend line or forecast overlay illustrating 2 0 2 0 - 2 0
Using Python code, create a line charts with a trend line or forecast overlay illustrating Nike sale trends over time to indicate the expected trajectory of sales for
Consider graphing the total number of units sold or price per unit to identify the cyclic or periodic factors in sales.
To enhance communication, add confidence intervals to the forecast to visually depict the range of uncertainty around the projections.
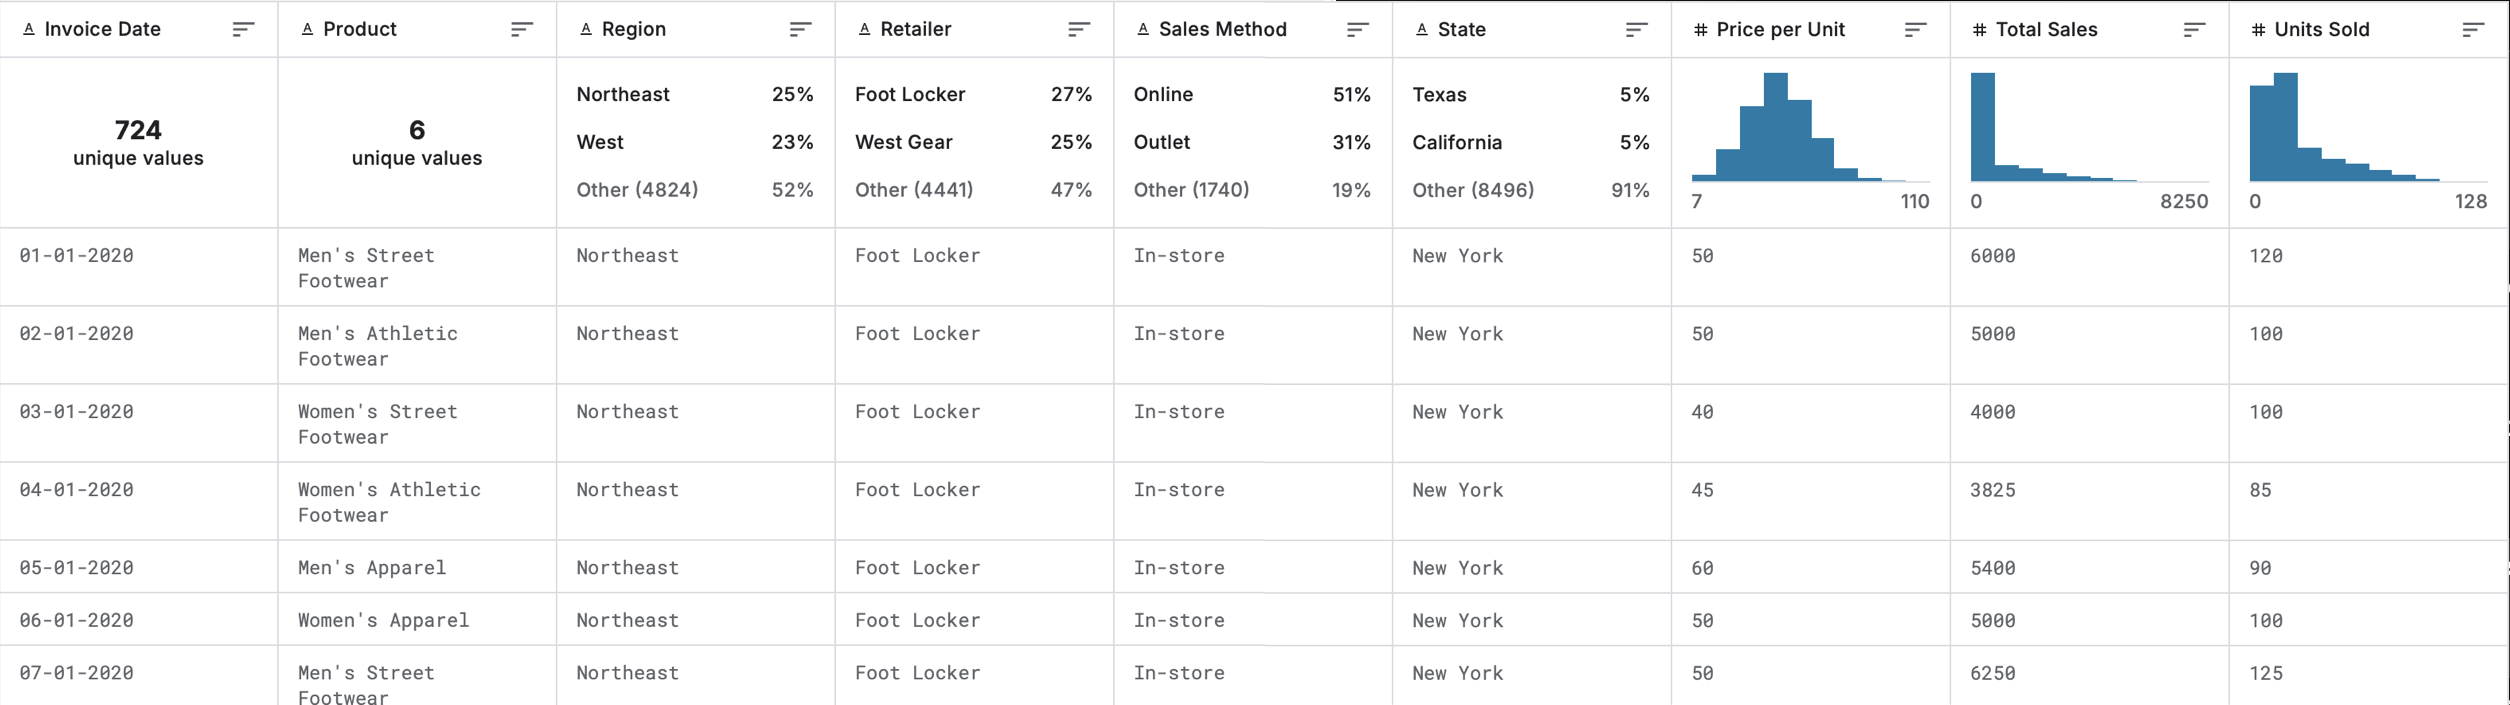
A section of the data set is included to use as a reference.
Step by Step Solution
There are 3 Steps involved in it
1 Expert Approved Answer
Step: 1 Unlock

Question Has Been Solved by an Expert!
Get step-by-step solutions from verified subject matter experts
Step: 2 Unlock
Step: 3 Unlock