

Question: using python for data science begin{tabular}{|ll|} hline & Table 2. Data Description Fields & Description hline Total_bill & The bill in dollars
using python for data science
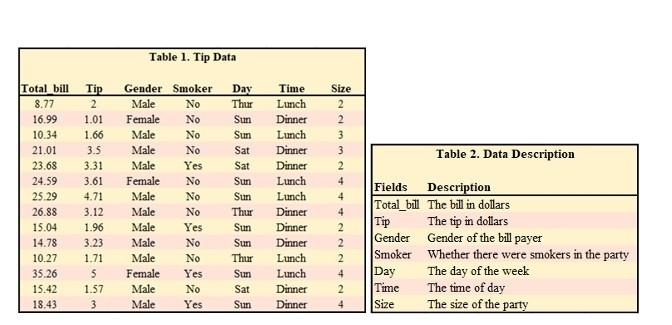
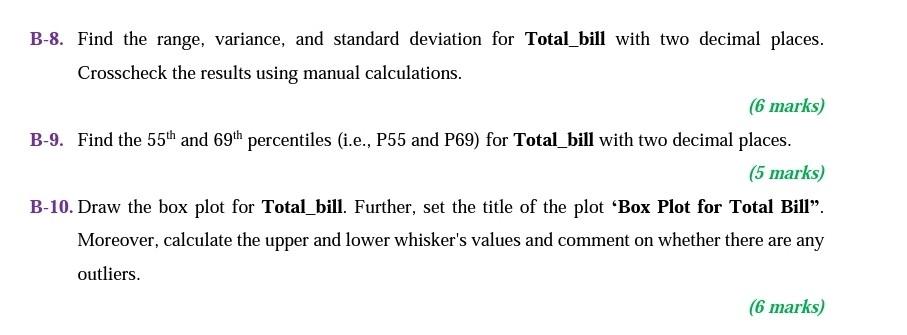
\begin{tabular}{|ll|} \hline & Table 2. Data Description \\ Fields & Description \\ \hline Total_bill & The bill in dollars \\ Tip & The tip in dollars \\ Gender & Gender of the bill payer \\ Smoker & Whether there were smokers in the party \\ Day & The day of the week \\ Time & The time of day \\ Size & The size of the party \\ \hline \end{tabular} B-8. Find the range, variance, and standard deviation for Total_bill with two decimal places. Crosscheck the results using manual calculations. (6 marks) B-9. Find the 55th and 69th percentiles (i.e., P55 and P69) for Total_bill with two decimal places. (5 marks) B-10. Draw the box plot for Total_bill. Further, set the title of the plot 'Box Plot for Total Bill". Moreover, calculate the upper and lower whisker's values and comment on whether there are any outliers
Step by Step Solution
There are 3 Steps involved in it

Get step-by-step solutions from verified subject matter experts