

Question: Using python or excel, how to make a 3D bargraph such that all bars can be seen clearly. I used excel to make a 3D
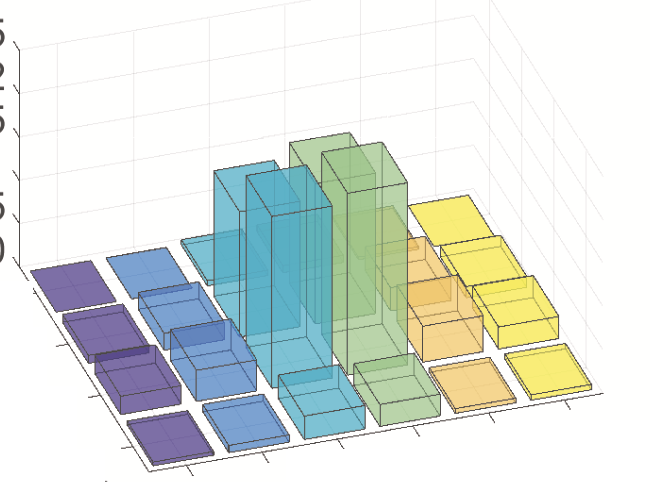
Using python or excel, how to make a 3D bargraph such that all bars can be seen clearly. I used excel to make a 3D bargraph from the data below but it is difficult to see the bars in the back row. I would prefer to make something similar to the second image, where all bars can be seen clearly from a higher viewpoint.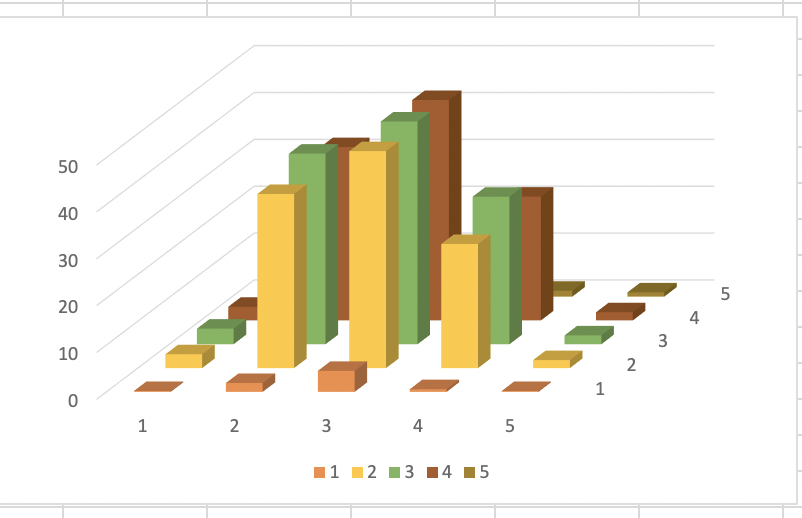
| 0.2 | 1.89 | 4.49 | 0.58 | 0.19 |
| 2.95 | 37.15 | 46.3 | 26.47 | 1.7 |
| 3.32 | 40.67 | 47.53 | 31.48 | 1.9 |
| 2.93 | 36.98 | 47.03 | 26.42 | 1.74 |
| 1.12 | 1.54 | 3.1 | 1.25 | 0.9 |
50 40 300 5 20 4 3 10 2 1 0 1 2 3 4 5 1 23 4 5
Step by Step Solution
There are 3 Steps involved in it
1 Expert Approved Answer
Step: 1 Unlock

Question Has Been Solved by an Expert!
Get step-by-step solutions from verified subject matter experts
Step: 2 Unlock
Step: 3 Unlock